Showing posts with label unemployment rate. Show all posts

Friday, May 17, 2013

Is the Recent Decline in RI's Labor Force an Anomaly?

Yesterday we received the April labor market data for Rhode Island. While many celebrated the fact that our state's jobless rate fell below 9%, I raised the question, as I have on numerous occasions over the years, about whether or not this is truly cause for celebration. Clearly, a lower jobless rate is preferred to a higher one. However, is important to assess not only the level of the unemployment rate but the reasons that underlie how (and why) it is changing.

My guess is that many people here believe that the April decline in our labor force that accompanied our jobless rate improvement really isn't very important, and that somehow this was a one time or rare event. Instead of my stating what I believe is the only reasonable conclusion here, I will let you judge for yourself. Below is a chart (click to enlarge) that shows Rhode Island's labor force and unemployment rate dating all the way back to 2009. Included in this chart is a vertical line denoting when the current recovery began (in February 2009).


I believe the graph illustrates rather conclusively that the combination of declines in both the unemployment rate and labor force is not the exception, but instead has been the rule over this entire period with few exceptions. Let me state that even prior to 2009, there were more instances that I can remember where we saw this combination of declines in both our unemployment rate and labor force.

In fact, when I designed my Current Conditions Index (CCI), I explicitly took this relationship into account, which I would not have done for any other state. Specifically, I included as two separate indicators the labor force and the unemployment rate. The significance of including them as a pair arises from months like April: an improving unemployment rate is a +1 for the monthly CCI value, while the decline in the labor force is a -1. The result is that these two changes cancel, leaving the  monthly CCI value unchanged. Therefore, a decline in Rhode Island's jobless rate by itself does not necessarily improve the Current Conditions Index value for a given month.

Let me conclude by noting a unique fact for Rhode Island. Rhode Island is the only state that has been consistently losing population since July of 2004. In general, a smaller population adversely impacts the size of a state's labor force. In the coming months, this will make it more difficult for Rhode Island to reverse the well-established downtrend in its labor force.

Friday, April 12, 2013

So, How's Rhode Island's Economy Doing?

New York City had a great mayor who recently passed away, Ed Koch. He became famous not only for his excellence as mayor, but for his saying: "So, how am I doing?" Now that Rhode Island's jobless rate has at long last fallen below double digits, this is a very good time to pose that question for Rhode Island's economy.  

It's particularly important to address this question for a number of reasons. Most importantly, in a well-run state, the leaders of that state continually assess both the strengths and weaknesses of their state's economy and work hard to make their economy more competitive. Clearly, they understand, to quote the old saying, that success is a journey, not a destination. But I digress. I want to talk about Rhode Island, which is hardly a well-run state and whose elected officials have yet to earn the designation "leaders."

One of the major factors that I believe has held Rhode Island back is the mindset and psychology of its elected officials. In Rhode Island, our elected officials seem to always do things the same way: they tend to restrict their focus exclusively to Rhode Island and its performance only at the present time. A number of years back, I attempted to develop a nomenclature for the psychology of Rhode Island's elected officials. In a 2008 article I wrote for The Providence Journal, I described this behavior, which characterizes that mindset all too accurately, as PAROPIC. What does this word mean? It is a combination of "parochial" and "myopic." Welcome to our world!

This focus by Rhode Island's elected officials has proven to be disastrous in terms of our ability to move our state's economy forward. Consider, for example, that in the past several months Rhode Island's unemployment rate finally fell below 10%. To our states leaders, this was an end in itself, since our "metrics" were moving in the right direction. Apparently, our elected officials interpreted this as indicating that everything was beginning to move in the right direction, and as far as I can tell, they viewed this as reflecting the beginning of "the turnaround" of Rhode Island's economy that will set all right here. For them, success is obviously a destination.

This was a textbook example of paropic behavior! Why? Because while Rhode Island's unemployment rate was declining, so too were the rates in almost every other state. Ironically, when these declines occurred, Rhode Island moved into a first-place tie for the highest unemployment rate in the United States (tied with California in January). The only way this reality ever made it into the consciousness of our state's elected officials was as the result of media stories that almost always take comparative national performance into account.

The real question here is why Rhode Island's rate jobless has remained among the highest in the country, even though it has been declining of late. Furthermore, it's important to keep in mind that the unemployment rate is a lagging economic indicator. We need to go behind the scenes for this number to understand what is really going on.

Fortunately, that's not very difficult to do. If you want to understand why Rhode Island's unemployment rate became so high and has remained elevated for so long, you need to go no farther than an examination of the recent behavior of payroll employment. But such analysis should not be paropic. An informed analysis will look at the temporal performance of Rhode Island's payroll employment relative to that of neighboring states, our region, and the entire US.

The chart below (click to enlarge) shows payroll employment for Rhode Island, Connecticut, Massachusetts, New England as a whole, and the US since 2005.


What should be apparent from the outset is that Rhode Island has clearly distinguished itself.  Not in terms of stellar performance, but by how it has underperformed all of the entities to which it is being compared over this period. What are the distinguishing features, or "stylized facts"  of Rhode Island's comparative payroll employment performance since 2005?
  1. Rhode Island's economy experienced its employment peak before that of everyone else in the chart;
  2. Payroll employment for Rhode Island fell noticeably farther in percentage terms than anyone else in this chart;
  3. While Rhode Island's payroll has clearly risen since its trough in mid-2009, it has risen more slowly than anyone else in this chart;
  4. From its employment trough, Rhode Island's payroll employment has only risen by 2.5 percent, far less than anyone else considered above; and
  5. As of January 2013, Rhode Island's payroll employment remained about 6 percent below its peak (in December of 2006).
If you want to see our comparative unemployment rate performance, you could gather all of the required data and replicate the chart above. A far simpler way, however, is to simply print out the above chart, flip the page, then turn it upside down. If you do this, you will likely be amazed at how good of a job it does in allowing you to visualize Rhode Island's joblessness in a non-paropic manner -- in relative terms through time.

Wednesday, June 20, 2012

Separating Fact from Fiction in Rhode Island's Labor Market Data


This is an article I wrote several weeks ago that the ProJo chose not to publish in its printed edition.
.......................

I've always admired weather forecasters. Whenever they want to know precisely what the current conditions are, all they have to do is look out the window. Things aren't quite that simple for economists. A great deal of the data we use is survey based. And, predictably, survey data are often revised, occasionally in ways that tell a very different story than what the originally released data showed.

This is the case Rhode Island right now. After my March Current Conditions Index report release, which showed that based on the existing data Rhode Island was flirting with the double-dip recession, I was informed by the Rhode Island Department of Labor and Training (DLT) that the likely upcoming revisions to their data will tell a strikingly different story. Instead of seven or eight months of consecutively declining employment, the upcoming data revisions apparently show that employment actually rose throughout that time period. What they did not say, but that is every bit as important, is that if employment has actually been rising, a number of other key indicators will also be affected, not the least of which is our state's unemployment rate.

Some of this was apparently discussed at the recent Revenue Estimating Conference and reported by the local media. However, with the release of the April labor market data, we only heard about the existing labor market data, which we now know is faulty. Whenever anyone turned on their television or read the local newspapers, they were told that Rhode Island's unemployment rate rose to 11.2 percent as employment fell yet again.

What an extraordinary time! I honestly can't remember ever being informed this close to the most recent rebenchmarking (data revisions) that such dramatic changes were coming. This placed the local media in quite a predicament, as they chose to report the April data as released by the DLT even though, as I pointed out to a number of them, we shouldn't put very much confidence in that data or the obvious conclusions that emerge from analyzing it.

So, at this point it is appropriate to quote the character Emily Litella of Saturday Night Live fame concerning Rhode Island’s large number of employment declines and the increase in our unemployment rate above 11 percent: Never Mind!

The origin of the situation we now find ourselves in is the result of cost cutting at the US Bureau of Labor Statistics (BLS). Soon, it will be taking over the task of producing the monthly employment numbers that was historically done by our DLT (this is also true for all other states). While this may well lower costs, its greatest cost to the people of Rhode Island will be the loss of all the experience and expertise of our DLT possesses. Furthermore, the way the BLS will produce their estimated labor market values will not incorporate as much known data as the DLT has in the past. Instead of beginning projections after the third quarter of the prior year, the BLS will start after the second quarter. Furthermore, and more troubling, Rhode Island will apparently be homogenized. By this I mean that exceptional circumstances or events that would routinely be analyzed and meaningfully incorporated into the labor market data by our DLT will now often be ignored by the BLS. As Rhode Island has an extremely idiosyncratic economy, this homogenization will make our state’s labor market performance appear to be very different from what it actually is at times. Ironically, the most obvious impact of this homogenization will be to make Rhode Island appear to more closely resemble overall US economy. If you don’t believe that, take one look at what the BLS has done with their estimation of our state’s manufacturing wage (especially look at the charts after Read More ...)!

Because of these extraordinary circumstances, I found it necessary to build a small econometric model of Rhode Island’s labor market in order to estimate and simulate various labor market indicators. According to my model, payroll employment has not been consecutively declining, as the existing data show, but is in a mild uptrend. At the Revenue Estimating Conference, the DLT offered tentative projections of where they believed payroll employment might be as of March. My model produces slightly more optimistic numbers. As of April, my estimate of payroll employment is slightly above 462,000, which is higher than the official April value of around 458,000. Instead of having eight consecutive employment declines in the last nine months, as indicated by the current DLT data, my model shows consecutive increases for seven of the past eight months, although not necessarily by large amounts. Along with this, my estimate of the April unemployment rate shows it declining to 10.7 percent, not rising to 11.2 percent. Even though my estimated jobless rate may appear to be “better” than the DLT’s official value, its foundations are less than flattering -- it is accompanied by declines in both our labor force and resident employment.

The current divergences in labor market data are not the fault of our state’s DLT, but the result of something forced upon them by the federal government -- a different methodology. While I continue to have the utmost faith in our state’s DLT, I am very irritated by the apparent attempt to politicize our state’s jobless numbers by the DLT’s spokesperson, Laura Hart. She recently offered an utterly ridiculous explanation as to why our state’s jobless rate is so high -- Rhode Island doesn’t have the economies of scale that states like Massachusetts have. If her hypothesis were correct, Delaware, another small state, would have a very high jobless rate, while California, an extremely large state, would have a very low jobless rate. For April, Delaware had a 6.8 percent jobless rate while that for California was 10.9 percent.

It’s bad enough that the diverging data exists. Having DLT’s spokesperson offer such ad hoc rationalizations only makes things worse.

Sunday, April 1, 2012

Believe It Or Not, Our Jobless Rate Could Be Worse

The last several posts have explored why Rhode Island has such a high unemployment rate. As of February, 2012, we have regained the dubious national rank of #2. If you saw the February labor market data for Rhode Island, the one number that probably stuck out was that our state's unemployment rate returned to 11 percent from just below that level the prior month. As for good news, the local media seemed to focus primarily on the 500 gain in payroll employment (seasonally adjusted). Actually, don't be very confident that the 500 gain will survive the data revisions associated with the release of the March data.

Actually there was good news  in the February report -- our state's manufacturing sector continues to improve. Both manufacturing employment and the workweek rose, very positive signs. And, our state's manufacturing wage continued to increase at an almost 20 percent year-over-year rate, if you are willing to believe that data (I don't!). Apparently there continues to be some life in Rhode Island's goods-producing sector, in spite of continued housing weakness!

By now, you should be aware of how many ironies permeate the existing labor market data for Rhode Island. To say this state is idiosyncratic is an understatement. So, let's delve into even more possible "confusion," focusing on labor force participation here and how its bad news has ironically translated into less horrible news for our jobless rate.

A state's labor force participation rate is the percentage of its working-age population that is in its labor force. For just about every state except Rhode Island, the labor force participation rate is pro-cyclical, meaning it changes in the same direction as overall economic activity. During recoveries, the participation rate rises, as a larger proportion of the working-age population becomes part of the labor force. Similarly, during recessions, the participation rate tends to decline, as some persons stop actively seeking work, which excludes them from being counted as part of the labor force. The reason why I noted this behavior is sadly not true for Rhode Island can be seen very readily from the following graph of our state's labor force participation rate since 2009 (click to enlarge).


Based on my Current Conditions Index, Rhode Island's present recovery began in February of 2010. As the above chart shows, Rhode Island's labor force participation rate has been declining throughout almost this entire recovery! So much for a pro-cyclical participation rate. Keep in mind, however, our state's employment rate has also been falling for quite a while (see prior post).

The irony associated with our state's declining participation rate is that it has actually kept Rhode Island's unemployment rate lower than it would have been had our state's residents not continued to drop out of the labor force. This is the "bad news translating into less horrible news" I referred to above.

All of this leads to an obvious question: How much higher would Rhode Island's unemployment rate have been were it not for the "benefit" of our declining participation rate? In order to approximate this, I performed a quick econometric simulation, assuming that our participation had not been declining from its most recent peak in April of 2010. The results are not pretty, nor are they unexpected. The chart below compares the actual and simulated unemployment rates here since 2009 (click to enlarge if you have a strong stomach!).


Instead of having an 11 percent unemployment rate for February of 2012, my simulation produced a rate of 11.6 percent. In the above chart, note the divergences between actual and simulated unemployment rates since August of last year. About the only good thing that can be concluded from this chart is that the two series have gotten closer of late. That is hardly a source of comfort, however, especially since at an 11 percent rate, Rhode Island has a national rank of second overall.

In conclusion, is Rhode Island's declining labor force participation rate a major problem? Indeed it is. Not only is it the logical result of a truly deplorable labor market, where both payroll and resident employment have been falling on a year-over-year basis for quite some time now. It may single-handedly be preventing Rhode Island from reclaiming its prior title as the highest unemployment rate in the entire United States!


Friday, March 23, 2012

A Bird's Eye View of Why RI Has Such a High Unemployment Rate

In the last several posts I analyzed the historical behavior of the number of jobs in Rhode Island, payroll employment, and the number of Rhode Island residents who are employed, resident employment. As I noted, there are significant differences between these two data series, especially since they are obtained from two separate labor market surveys.

In this post, I will provide only one chart, but that chart will allow you to understand very readily why Rhode Island's unemployment is so high and why it hasn't been falling as one would expect during a recovery. Of course, as I was writing that last sentence, I realized that there is a distinct possibility that Rhode Island is no longer in a recovery, which I discussed in the last two posts. For now, I still haven't concluded that Rhode Island has actually entered a double-dip recession, so as far as I can tell, Rhode Island is clinging to its two-year old recovery by its finger nails. I guess this makes it fortunate that we didn't raise the sales tax on finger nail establishment services last year!

I want to focus on the employment rate for Rhode Island: the ratio of resident employment to the resident working-age population. Both of these series are derived from the household survey. Ideally, this ratio should rise during recoveries, as the number of employed residents rises as a proportion of the working-age population, and fall during recessions, as employed residents become a smaller proportion of the population. But this is Rhode Island -- we don't do things like everyone else!

The chart below shows the historical behavior of the employment rate for Rhode Island since January of 2000 (click to enlarge).


When Rhode Island's payroll employment peaked all the way back in December of 2006 (a full year before the US peak), our state's employment rate reached its maximum at just below 66 percent (0.66 in the chart). It has literally been all downhill since then.

Clearly, the serious recession we experienced brought about continuous large reductions in the proportion of our state's population that is employed. However, consistent with the charts from the previous two posts, Rhode Island's employment rate has been declining throughout this entire recovery! At the end of the last recession, around late 2009 into very early 2010, the employment rate actually recovered a bit, moving back to 60 percent. Ironically, since our current (?) recovery began in February of 2010, we have seen a clear downtrend in this ratio.


The inevitable consequence of the fact that an ever-smaller proportion of Rhode Island's population remains employed (our declining employment rate) has been a high unemployment rate that seems incapable of falling below 11 percent over any prolonged period of time.

There are several ironic elements in all of this. Recall that resident employment is not restricted to jobs in Rhode Island. It includes Rhode Island residents who work either in Rhode Island or in other places. That is significant at the present time since Massachusetts is doing so much better than Rhode Island is, as its jobless rate is one we can only fantasize about here. Also, resident employment includes self-employed persons, an element that often escapes from the other labor market survey. Positive out-of-state and self-employment should have been able to at least moderate if not reverse our declining employment rate by this point. Yet it hasn't.

To conclude, let me briefly cite the math that underlies a declining ratio. The fact that the employment rate, the ratio of resident employment to our working-age population, is falling through time means that in percentage terms, resident employment has been falling relative to our state's working-age population. It doesn't take much to figure out that this has played a central element in our state's high unemployment rate.


Sunday, October 2, 2011

It's Not Supposed to Be Like This!

Pardon the fact that I have not posted anything for a while, I switched from Cox Cable to FiOS (ready my post about issues I was having) and had to make all the required changes associated with this. Please note that my web site has now been moved to http://www.llardaro.com .

As sooooo many people here continue to summarize Rhode Island's overall economic performance by the recent behavior of its unemployment rate, the collective grasp of how well our state's economy is actually performing continues to slip farther and farther away from reality. 

Recent gains in payroll employment here, which have at times appeared to defy gravity, seem to contradict any hint of weakness, reinforcing the declining unemployment reflects economic strength view. You might think that these large monthly employment gains have been a potential source of confusion to me, as my Current Conditions Index has continued to show a slowing pace of economic activity in Rhode Island. But as of 2011, I have been following Rhode Island's economy for twenty years. Suffice it to say that along the way I have observed and come to know all too many patterns and data combinations that reflect the idiosyncrasies of Rhode Island's economy.

But one doesn't need all this experience to know that it is always preferable to focus on a set of indicators, not any one single variable, to gain an accurate picture of Rhode Island's economic performance. That, of course, was the basis for my creating the Current Conditions Index. And even for a single indicator like payroll employment, there are often several related measures worthy of observation. 

As I have discussed in prior posts, there are two measures of overall employment for Rhode Island. The first, which I have been alluding to above, is payroll employment, the number of jobs in Rhode Island. The second is resident employment, the number of Rhode Islander residents who are working, irrespective of whether this occurs in or outside of Rhode Island. One major difference between these is the inclusion of self-employed persons in resident employment. And that difference matters a great deal in the early stages of recoveries or at turning points for the economy. 

The chart below shows the recent behavior for both employment measures here (click to enlarge):


Note that the year-over-year rate of growth for resident employment peaked before the end of 2010 and has continued to decline, becoming ever-more negative, as 2011 progressed. For payroll employment there is a very different story: after moving to a positive rate of growth in the beginning of 2011, growth continued to accelerate through June. For July there was a modest slowing in growth, before plummeting to an almost 0% growth rate in August. So, was employment here really rising or falling recently?

RESULT #1: Regarding the recent behavior of payroll employment: POSITIVE MEASUREMENT ERROR COMETH BEFORE THE FALL

The dramatic-appearing run up in payroll employment should therefore be viewed as spurious, overstating payroll strength. In August, think of payroll employment figure as a "burp," expelling the measurement error that had accumulated in prior months.

Next, let's link the recent declines in Rhode Island's unemployment rate to changes in employment -- but the employment measure that is in the same survey it is -- the household survey (click to enlarge):


Shouldn't the unemployment rate only fall when employment is rising? While that certainly sounds reasonable and intuitive, it is not necessarily true. First, which measure of employment is this referring to? Second, since the beginning of 2011, Rhode Island's unemployment rate has been declining along with its resident employment

RESULT #2: THE UNEMPLOYMENT RATE CAN DECLINE EVEN WHEN RESIDENT EMPLOYMENT IS FALLING.

Obviously, there must be another force at work for this to occur, one that is obviously not intuitive. That force is the behavior of our state's labor force, as the next graph shows (click to enlarge):


Rhode Island's labor force has been declining since early 2011, along with both resident employment and the number of unemployed. The fact that the number of unemployed has been declining, even though resident employment has also been falling, is what lies at the heart of the explanation of this strange seeming combination of changes.

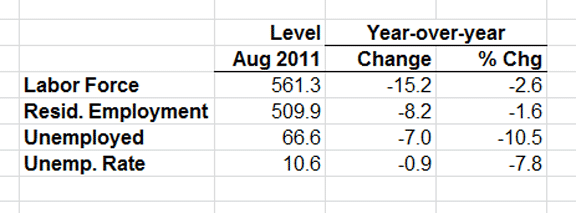
The math of August's numbers can be obtained from the following table (data in thousands) (click to enlarge):

Compared to last August, the number of unemployed Rhode Islanders fell by 7,000. That's the good news. But while this was occurring, Rhode Island's labor force declined by 15,200, and its resident employment dropped by 8,200. The trick to understanding this is knowing how the ultimate change in the unemployment rate is determined: the percentage change in the unemployment rate (-7.8%) is approximately equal to the difference between the percentage changes in the number of unemployed (-10.5%) and the labor force (-2.6%).  To simplify this a bit: even though the number of employed Rhode Island residents declined compared to a year ago, in percentage terms, the fall in the number of unemployed was greater than the decline in the labor force. Also, note that while the fall in resident employment was a fairly large number  (8,200), in percentage terms, this was "only" a fall of 1.6 percent, far smaller than the drop in the number of unemployed.

Let me conclude by moving from the math of these calculations and show that in spite of these percentage changes and the way the unemployment rate is calculated, the August data show that a substantial number of Rhode Island's unemployed dropped out of the labor force, presumably as they were unable to obtain suitable employment. Make no mistake, however, the simultaneous and relatively large drop in resident employment is every bit as troubling as this, as it is reasonable to conclude from this rather rare trend that thousands of self-employed Rhode Islanders also "threw in the towel" on their business enterprises. Either way, this indicates that Rhode Island has entered a period of slower economic growth, which is entirely consistent with the recent behavior of my Current Conditions Index

RESULT #3: ALWAYS FOLLOW A SET OF ECONOMIC INDICATORS RATHER THAN A SINGLE ONE.

Tuesday, July 26, 2011

Our State's Jobless Rate is Declining. Is That Good News?

In recent months, Rhode Island's unemployment has been falling. In fact, whenever the monthly labor market numbers are released, the local media focus largely, if not entirely, on the unemployment rate and how it changed. So, based on these recent declines, Rhode Island's economy must be doing noticeably better. Or is it?

First, it is critical that this statistic be viewed in relative, not absolute, terms. While Rhode Island's unemployment rate has fallen from 11.5 percent, its level from August through December of 2010, to 10.8 percent in June of 2011, it remains the third highest in the entire US! So, Rhode Island continues to be known for its beautiful beaches and its very high unemployment rate. Quite a niche, isn't it? Let me also state for the record that I don't believe that our state's jobless rate was constant over that long of a period. The single value for the entire August to December of 2010 period is doubtless the result of a smoothing procedure utilized by the US Department of Labor.

Second, we must not forget to consider the way the unemployment rate itself is calculated. To be counted as unemployed, and therefore part of the monthly statistic, an unemployed person must be unemployed (obviously), physically able to work, and this is the kicker, actively seeking employment. What that last condition indicates is that it is quite possible for the unemployment rate the fall not as the result of higher employment, as most people think has to be the case, but because unemployed persons opt to cease their active job search. In economics, this is known as the "discouraged worker effect." Actually, that's a pretty dumb name, since these people obviously aren't working and they're well beyond being discouraged. So, if an unemployed person stops actively seeking employment, that person is no longer counted as being part of the labor force, and is therefore not counted as being among the "officially" unemployed. In light of all of this, you should always view the unemployment rate and labor force participation together. Has this odd combination of declining labor force and falling unemployment been occurring in Rhode Island lately? A picture is worth a thousand words. The chart below (click to enlarge) shows these two elements in Rhode Island for the last twelve months.

Do you see a pattern here? Actually, how can you miss it? For the entire time that Rhode Island's unemployment rate has been declining (all of 2011), our state' labor force participation rate has been declining as well. Note: the labor force participation rate  (the red line in the chart above) is the percentage of our state's working age population that is in the labor force. Based on the chart above, there is definite evidence consistent with recent declines in our state's unemployment rate being at least partially related to Rhode Island residents dropping out of the labor force (as they stop actively seeking employment). And there can be strange results from the monthly Household Survey (see previous blog post on this). But this doesn't tell the entire story.

Third, there are actually two labor market surveys. The unemployment rate is obtained from the Household Survey. I won't tell you how small the sample size is for Rhode Island. This survey looks at Rhode Island's working age population and does not restrict employment to being exclusively within Rhode Island. So, Rhode Island residents working in other states are included in this survey, as are self-employed individuals. The other labor market survey, the Establishment Survey (and approximations to this by the Current Employment Survey in the short-term), focus exclusively on jobs within Rhode Island. Self-employed individuals, however, are excluded from this survey. So, given these differences, it is not uncommon for the two surveys to give different results, sometimes very different results. In recent months, survey results were noticeably different at times. Fortunately, though, the results for June were more in line with each other. Looking at recent results for this employment survey, job gains since January of this year (compared to a year ago), rose from 4,100 to a high of 9,400 in May, before declining to 8,800 in June. Throughout that time period, job loss fluctuated between 4,100 and 5,100. So, the net change in payroll employment here (what the local media inevitably reports as "new jobs" has actually been in an uptrend since January of this year. For the most recent three months, the net change in employment has been greater than 4,000. Thus, part of the reason for our state's declining unemployment rate over this period has in fact been for the "right" reason - improving employment (also see previous blog post dealing with this).

Finally, the unemployment rate is what economists refer to as a lagging indicator. In other words, its behavior this month to a large extent reflects events and trends that occurred in past months. Embodied within the way the unemployment rate is calculated is the likelihood that when an economy begins to improve, some discouraged workers will begin to actively seek employment once again. When that happens, they are once again counted as being part of the labor force and unemployed. This will often result is an increase in the unemployment rate, not a decrease, as one would normally assume when economic conditions improve. Rhode Island's declining participation rate itself is a net change of persons leaving (discouraged workers) and persons re-entering the labor force once they re-commence active job search.

So, has Rhode Island's economic performance, as summarized by the recent performance of its jobless rate been improving? Yes and no. Unequivocally! To summarize: Rhode Island's unemployment rate has been improving of late, yet it remains among the highest in the US; improvements in our state's jobless rate are not entirely the result of a better employment climate, but at least partially the result of our unemployed dropping out of the labor force.

MY REQUEST TO THE LOCAL MEDIA (an economist's pathetic plea!):
Please stop focusing so much on our state's unemployment rate, it is not a very accurate basis for portraying our state's overall economic performance. You need a much broader basis to do this accurately, such as my Current Conditions Index.

If, however, you opt to continue using the unemployment rate as your primary basis for assessing economic activity here, when you drive home after writing your story, only look in your rear view mirror for guidance the entire time (a practical example of relying on a lagging indicator). Let's see whether or not you make it home in one piece!

Thursday, July 7, 2011

Rhode Island's Surprising Cyclical Strength

Although it still comes as a surprise to many Rhode Islanders, Rhode Island has been in a recovery since February of 2010. As of the time this is being written, we are approaching the one and a half year mark for this recovery.

In a number of blog posts I have spelled out precisely what a recovery means -- not a return to "normal" times, but a period where the overall level of economic activity is rising. The pace of the recovery ultimately determines how long it will take to return to "normal" times or to peak levels from the prior recovery for key indicators.


Over the past four months, employment in Rhode Island has turned in a surprisingly strong performance. On a year-over-year basis, while job loss has remained roughly constant, job gains have clearly accelerated (see blog post on this).  The result is important enough to show the following graph again here (click to enlarge).


As I was preparing monthly data for my next Current Conditions Index release, I came upon something that is also very welcome but unexpected: layoffs in Rhode Island have now fallen below their median level going all the way back to January of 2000. The next chart shows layoffs over this period (click to enlarge):


I used the median for this since the extreme values of layoffs during the last recession would push the mean significantly higher. The median, which is the middle value when all values are arranged in ascending order, will not get "pulled" higher as the mean would, so it is the preferred measure of "central tendency" here.

Three important points need to be made about the indicators reflected in these graphs. First, layoffs (actually New Claims for Unemployment Insurance), which is one of the indicators in my Current Conditions Index, is a leading economic indicator. This means that its changes today signal future movements in the overall level of economic activity. So, declining layoffs signal that Rhode Island's economy has been gaining momentum of late. Second, payroll employment overall, or its components, job gain and job loss, are coincident indicators, meaning that their changes reflect the current performance of the overall economy. From the first chart, the acceleration of job gain relative to job loss confirms what the recent downtrend in layoffs implies, that Rhode Island's overall economic performance is improving. Finally, since Rhode Island has income and sales taxes, improving levels of overall economic activity, which produce higher levels of income, result in added income and sales tax revenue. This is the basis for the recent "surprises" in tax revenue our state has witnessed.

What about the fact that Rhode Island's unemployment rate has remained stuck around 11 percent as these changes in layoffs and job gains have been occurring? While everyone pays a great deal of attention to the unemployment rate, it doesn't always move in lockstep with changes in payroll employment, for several reasons. Among other things, it is derived from a separate labor market survey, the household survey. And, the unemployment rate is a lagging indicator, so its changes now reflect what has occurred in past months. There is also a strange footnote to the way the unemployment rate is calculated: unemployed persons who stop actively seeking work are not counted as being part of the labor force, therefore they are excluded from the monthly unemployment number. The flip side of this is that when an economy improves, and some of the unemployed who had stopped looking for work begin once again to search for employment, they are now counted as part of the labor force, which tends to cause a short-term rise in the unemployment rate. However, recent declines in Rhode Island's jobless rate have largely been the result of our unemployed ceasing job search. So, it is quite possible that Rhode Island's unemployment rate might actually rise before it resumes declines based on the behavior of layoffs and job gains discussed above.

Let me point out a strange element of Rhode Island's current economic climate. Our state's jobless rate was third highest in the nation in May. Yet in spite of having so many unemployed persons here, and such a high unemployment rate, manufacturing wage growth has been very strong. While this signals recent manufacturing strength here, it also reflects the existence of skill shortages. Go figure!

Finally, at the same time Rhode Island's economy has experienced this enhanced cyclical momentum, a substantial number of structural negatives, most notably the lack of skills of our labor force, have offset some or much of this cyclical momentum. That explains why this recovery doesn't necessarily feel all that different from being in a recession.

EPILOGUE: After posting this last evening (7/7), the June payroll employment report for the US came out this morning. The results took everyone (including me) by surprise, as national employment rose by only 18,000, well below prior expectations. It will be very interesting to see the June numbers for Rhode Island when they are released in a few weeks. If they show no employment pause here, I will have to question the last few months of data here. I'll have a lot more to say on this if it actually occurs.

Monday, June 20, 2011

May 2011 Labor Market Data

The labor market data for May of 2011 have now been released. As always, Rhode Islanders and their media focused on the unchanged unemployment rate from April, 10.9%. And, in numerous stories, employment was described as "adding 1,300 jobs compared to April." If one goes behind the numbers, as I always do, there's a lot more going on, and as always, the jobs added figure that was reported was incorrect.

Perspective: I highly recommend that persons consider not just looking at data like this by focusing on the change from one month to the next (called month-to-month, or M/M). Very often it gets revised, so what we think happened this month ends up being changed, for better or worse, the next month. While it is useful (albeit fleeting) to look at month-to-month change, it is preferable to consider both what happened compared to a year ago (called year-over-year, or Y/Y) and the one-month change.

Unemployment Rate: Looking at Rhode Island's unchanged (M/M) unemployment rate in May, 10.9%, this was well below its level last May's value of 11.7%. However, our state's labor force fell over this period, by a number roughly equivalent to the decline in the number of unemployed. Conclusion: the "improvement" in our state's jobless rate from a year ago was largely due to unemployed Rhode Islanders dropping out of the labor force which statistically lead to their no longer being counted when the rate was calculated.

Another point I need to make concerns an extreme rarity that occurred with the May data. Unemployment data along with the number of working Rhode Island residents comes from the Household Survey. Forgive me as I provide the basic labor market identity:

LF = E + U

or Rhode Island's labor force (LF) for any period is the sum of the number employed of employed Rhode Islanders (E), referred to as resident employment, plus the number unemployed (U) Rhode Islanders. Here's the rare occurrence we witnessed with the monthly data (change from April to May of 2011):

Change in LF = -1,400
Change in E = -1,400
Change in U = -100

Obviously, there is rounding error here which should be overlooked. Here's the oddity: while our state's unemployment rate remained unchanged at 10.9%, there were 1,400 fewer Rhode Island residents employed (we'll overlook the change in U here). How and why would employed Rhode Islanders drop out of the labor force? It would be very easy to explain why unemployed persons would drop out -- lack of job opportunities. But employed??? The best explanation I can come up with is that a number of self-employed Rhode Islanders weren't doing so well and packed things in (literally). I guess they then went to a status where they opted not to look for work, leading to roughly similar declines in resident employment and the labor force. Will this oddity be present when the June data are released in a month? I wouldn't at all be surprised if it disappears!

Employment: As if all of this weren't confusing enough, there are actually two separate measures of employment. The first, presented above, from the household survey, is resident employment, the number of Rhode Islanders working, whether in Rhode Island or somewhere else. There is a second survey, the establishment survey, that counts the number of jobs in Rhode Island, or payroll employment. Unlike resident employment, this measure does not count self-employment. And, in order to compare adjacent months, the data must take seasonality into account, using seasonal adjustment.

Comparing month-to-month changes in employment, for resident employment, there was a decline of 1,400 (see above). For payroll employment, the gain that was reported was 1,300. The fact that there were different changes in both measures is not uncommon. What must be taken into account, however, is that the payroll employment figure for jobs added is almost always reported incorrectly.

To give a sense for why this is so, let me change to year-over-year payroll employment change, the measure I pay most attention to since monthly changes are often modified the next month. The chart below (click to enlarge) gives the number of jobs added and jobs lost over the last year.


Let's focus on May of 2011. For that month, Rhode Island had job gains of 9,500 versus job losses of 5,300. The net change in employment (year-over-year) was therefore 4,200. The local media, however, always reports this as 4,200 jobs added, which is clearly incorrect. Since February of this year, job gains in Rhode Island have clearly accelerated. Sadly, job loss has remained stubbornly high, leading to overall employment growth (i.e., change) of less that one percent (0.9% for May). 

So, this look into the labor market data released each month should illustrate that there's a lot more going on than any simple explanation can accurately conclude. Keep in mind that there are two labor market surveys, not one, and these often reflect different forces at work and thus come to different conclusions. And, for someone who has been following all of this in depth for as long as I have, sometimes I don't even understand all of what's going on. I guess that's why God invented data revisions!

Friday, April 29, 2011

Rhode Island Unemployment in 2010

While Rhode Island's overall unemployment rate remains among the highest in the country (we seem stuck at  #4 overall), the state's overall average rate masks how much unemployment rates differ among persons in different age groups. The chart below shows the age-breakdown for jobless rates in Rhode Island during 2010 (click to enlarge).

Like the US, Rhode Island had very high teenage unemployment in 2010 (over 25%). But, unlike so many other states, only two age groups had 2010 unemployment rates below 9 percent in this state. A truly incredible statistic (now shown in the chart): the 2010 Rhode Island unemployment rate for teenage males was 35.3 percent, versus "only" 16.5 percent for females. While the participation rates for male teenagers is below that for female teens, this is still a cause for alarm and concern.

Anyone who claims that what the above chart reflects is purely a cyclical phenomenon, related almost exclusively to national and global weakness, is very far off the mark. Yet this is the exactly what (too) many of thing our state's elected "leaders" have been saying since 2008! While the national and global problems did magnify problems here, Rhode Island was far along the path of substantial weakness before those national problems emerged (read my first Blog post that lays out the "stylized facts" for Rhode Island's economy).

So, what is Rhode Island's exit strategy? How do we plan to make truly meaningful inroads into reducing our high across-the-board high unemployment rates, especially when as we balance budgets with large deficits? How these budgets are balanced will be every bit as important as balancing them in general!

Thursday, April 7, 2011

Why is RI's Unemployment Rate So High?

"The" question for Rhode Island -- how can your state's unemployment rate be so high for no obvious reason? For anyone who has observed (or lived through) the way things are done here, the reasons are obvious and numerous. However, a picture can often say a thousand words. Here's my picture (click to enlarge):

If you want to know why our state's unemployment rate is and has been so high (#4 nationally), you need only consider its flip side -- employment. As my last post showed, employment here peaked in December of 2006 -- a full year before the US! So, a prolonged period of substantial employment declines (8% ultimately), created ever-rising unemployment rates.

Wednesday, October 13, 2010

Scary Questions about R.I.'s Economy (from the ProJo 10/9/2010 as I originally wrote this plus a labor market chart)

Everyone seems to gauge overall economic performance by the recent performance of the unemployment rate. If you listen to the media and my many of my fellow economists, you will frequently hear that the only way the unemployment rate can decline is for employment to begin rising substantially from where it is today. These newly added jobs will then directly reduce unemployment, leading us at long last to a period where the unemployment rate is well below its current levels. There are two potential difficulties within this scenario, which explains why this process is taking so long. On the labor supply side, much of the current unemployment is long-term in nature, the result of jobless persons failing to possess the skills demanded by the employers who are attempting to increase employment. Economists refer to this as "structural unemployment." The result is skill shortages, even with so high a jobless rate. On the demand side, employers have continued to find ways of meeting current product demand with fewer hours worked by their labor force than they thought possible in the past. This has produced rather sharp gains in productivity. The failure to hire by small and medium-sized firms has been exacerbated by their inability to borrow funds due to inadequate collateral. And, of course, uncertainties about the future also play a role, for firms of all sizes.

But is this the only possible scenario? And, how does all of this pertain to Rhode Island? Actually, employment gains have been occurring here for several months now. Since October of 2009, job gains have generally been above 1,000 each month (except for April of 2010). In fact, over the October 2009 through August 2010 period, Rhode Island's average job gain (year-over-year) has been just over 2,000 per month (see chart below -- click to enlarge it). How can this be with so high an unemployment rate? The answer is that while job gains are occurring, so too are job losses. From October 2009 through August 2010, monthly job losses for Rhode Island averaged around 15,250. Thus the proper context for analyzing overall employment change in Rhode Island is a simultaneous focus on job gains and job losses. While monthly job loss has declined sharply since the height of the post-2008 period, job gains have increased very little. But they are increasing. So, the question becomes what will be required for Rhode Island to generate substantial and increasing job gains?


 A viable response to this question requires that we confront what I view as the two scariest questions about Rhode Island's economy at present. First, does Rhode Island have a tax and cost structure consistent with generating the types of employment gains needed to substantially reduce unemployment? Second, what are our current engines of job growth? Importantly, these questions are not unrelated. Our children have known the answers for years. Ask them when they come back to Rhode Island to visit. The answer to the first question is not yet, even with the two-year-delayed tax reforms. As for the second question, our engines of growth at present are health services and tourism. While a small but growing tech sector is helping us, past failures of economic leadership here have relegated non-defense tech to levels that require time before they can make a substantial impact on our state's overall rate of growth.

Fortunately or not, for Rhode Island there is another way we can and likely will witness material reductions in our jobless rate. Rhode Island has a very high labor force participation rate, the proportion of our (non-institutional) working age population that is in the labor force. At present, Rhode Island's participation rate is just under 69 percent, a rate almost five full percentage points above the national rate. Over the past five months, as Rhode Island's unemployment rate fell from 12.5 percent to 11.8 percent, its labor force participation rate also fell. This indicates that some of our state's unemployed stopped looking for work over that period. Based on the way labor force statistics are calculated, they were no longer counted as being in our state's labor force. So, as increasing numbers of Rhode Islanders exhaust all benefit entitlement, if they then stop seeking employment, as is likely, our state's unemployment rate could potentially decline substantially from its current level, even without large employment gains.

June marked the third anniversary of Rhode Island's current recession. We have been through a great deal since our recession began in June of 2007. Perhaps that understates things a little (if that is possible) since our employment peaked in January of 2007, almost a full year before the national peak. Things never had to be this bad for Rhode Island. Is the second way I suggested for reducing our state's unemployment rate the best we can do? I refuse to believe that.

November's elections hold the potential for our state to make meaningful changes to the way things are done here. Voters must ask very difficult questions and demand highly specific answers to anyone running for statewide office. Sorry, wish lists don't work here!
  1. Candidates should be forced to outline in detail how Rhode Island will emerge from this recession.
  2. What specific measures do they propose for materially increasing job gains relative to the losses that will occur over the next two (or four) years?
  3. What are Rhode Island's economic strengths? How can those be built upon (i.e., what is Rhode Island's niche)?
  4. What are Rhode Island's major economic weaknesses? They should outline in detail proposals to eliminate these, or to somehow turn them into positives.
The upcoming election is more important than is generally presumed for Rhode Island, since federal bailout money will no longer be available by this time next year. Fiscally, this will force us to go "cold turkey." The resulting jolt to a fragile upturn may well force our state into a double-dip recession. The citizens of this state need to be proactive, even though our elected officials seldom are.

FOR A COMPLETE HISTORY OF THE CURRENT CONDITIONS INDEX AND ITS PERFORMANCE, VISIT MY WEB SITE: http://members.cox.net/lardaro/ . THE SECTION ON THE CURRENT CONDITIONS INDEX IS: http://members.cox.net/lardaro/current.htm .


Wednesday, September 22, 2010

With Recession Over, What's Next?

Now that the US recession has officially been declared as being over, the most obvious and pressing question is where we go from here?

As there are confusions about what a recession or recovery actually means (see the previous post), there are just as many confusions concerning whether we are actually in a recovery or a recession. I have provided a chart that will help to illustrate this point (click the chart to enlarge it).

I think it is safe to say that generally, most people refuse to believe the pronouncements of economists concerning when an economy is in the very early stages of either recession or recovery. Consider early recession in the chart. Note that the economy is not very far from its peak in economic activity. So, when economic data are released, the numbers are still very good in a historical context. In fact, unless you focus on what economists refer to as leading economic indicators, the numbers will show an economy that is still climbing the activity "hill" (i.e., to the left of the peak), making it even more difficult to assess what is actually taking place. Perhaps the best example of this is the one measure the general population focuses on most -- the unemployment rate. This is a lagging indicator, meaning its level at present reflects what happened in months past. Remember: a recession is NOT defined as a level of diminished economic activity. As the National Bureau of Economic Research (the "dating" body for economic cycles) points out, it is instead a period of diminishing activity. This highlights the distinction between levels and rates of change that I discussed in the previous post.

Right now, nationally at least, we find ourselves in the early stages of a recovery. Once again, look at the chart above. In the early stages of a recovery, an economy is close to the "bottom" of economic activity. The numbers that are released are therefore not going to be very good, and after a recession period, often discouraging. Of course, if you focus on lagging indicators, you will almost certainly conclude that we are still in a recession.

At this point, I need to reiterate that contrary to popular "wisdom," being in a recovery does not necessarily require a return to "normal" times and historical averages (or above) of economic variables. It might. But generally it takes some time to get back to "typical" levels. The next chart will help to explain this.

As this chart should illustrate, not all recoveries are alike. Each path reflects how rapidly economic activity will be rising in the future. Historically, when there is a very deep national recession like the one we just had, the economy rebounds quickly. This leads to a "V" shaped recovery (the green line). It doesn't take all that long to return to "normal" levels of economic activity. In that situation, a recovery feels like a recovery.

But recovery paths are different since not all recessions are the same. Global recessions occur over longer periods and are generally more damaging than more "typical" recessions. When there is a global recession with major financial problems, as the one we just had, the pace of recovery tends to be slow and it takes a longer time to return to "normal" levels of economic activity (the red line). Consider that at present, individuals are spending less, saving, and paying down debt. Banks have lowered leverage. All of this is very positive in the medium to longer term, but it extracts a cost on the rate of economic growth in the short term. Add to this  the fact that banks aren't lending as much as they might have in previous recoveries, and you get what Mohammed El-Erian of Pimco refers to as "The New Normal" (click here for a video of El-Erian explaining this concept). He and I are somewhat concerned with the possibility of deflation in the near-term as well.

So, where does all of this leave us? What are you to think? Hopefully you are now more aware of  the basics of what is really going on, what an early recovery means, and the possible paths the US economy might take. THE question is which path will be the one our economy follows. Let me be very honest about this: economists, including me, don't really know the answer to this, in spite of all our forecasts and predictions. In this context, let me state one of my favorite sayings: CERTAINTY IS AN ILLUSION. Any forecast, no matter who makes it, is essentially a scenario. It assumes what the areas are that will be the most important over the forecast period, how each of those areas will actually change, and the interactions between and among them. Obviously, there are numerous sources of potential error.

In a period of such uncertainty, where things seldom appear to be what they actually are, many persons are all too willing to step forward with their "solutions." While these might sound good, or appeal to the increasingly subjective notion of "common sense," they too are based on scenarios. So, they might be right. Or, they might be wrong. Let me recommend that you critique any or all of these within the context of one of my favorite sayings: "Complex problems have simple, easy to understand, wrong answers."

Let me finish by acknowledging that at this point you are no doubt wondering where I stand on the future path of economic growth. I will outline this in the coming days (it's time for me to get to class). Before doing that, I need to apply the information in these last two posts to what is occurring in Rhode Island. Stay tuned!

Sunday, September 19, 2010

Welcome to this Blog!

This is the first of what promises to be many posts to this newly created blog that will detail my views about economics and the Rhode Island economy using the tools of the internet. Unlike what I have been able to provide to the local newspapers over the years, this blog will include graphs, tables, videos, and other media-relevant tools that will allow me to communicate in a far more visual way than I could ever do in newspaper articles. Those who have come to my presentations over the years will already be familiar with the types of tables and graphs I will provide here. But, unlike what I am able to say to the local media, I will come far closer to stating what I really think in this Blog. The stakes now are far too high for us to sustain the way things are being done here.

Through time, I will publish articles that what I would have submitted as Op-Ed pieces to local newspapers in this blog. At times, posts might consist only of questions that need to be discussed and answered by others in this state. Let me state that I fully intend to provide realistic analyses of where Rhode Island's economy is and where it is headed, as I have done for years.

To a number of our state's "leaders" over the years, my efforts to do this have always been viewed as "being negative." But if we don't critically and honestly evaluate both the strengths and weaknesses of our state's economy, how can we realistically expect to make it better and stronger, able to move forward competitively? We didn't do this over the last decade, especially when we finally got back on our feet in the late 1990s when we had a clear window of opportunity (see my article from 1999  and the report card I proposed that our legislators use). The result was that we were "flat footed" during the worst recession this state has faced since 1991!

It is reasonable to ascertain that the persons who have labelled me as being negative are the image of what this state defines as being "positive." If impeding efforts to make this state more competitive in the future when we had a chance to do so, then abandoning the people of this state during its worst economic crisis in twenty years is Rhode Island's definition of "positive," then please do label me as "negative."

Consistent with using internet tools, let me present two graphs that scared the hell out of me from the moment I first created them (click to enlarge them). I knew things had been very bad here, but never this comparatively bad. I generated these while writing an article about Rhode Island's high unemployment rate for a Boston Federal Reserve Publication. If I had to name these, the first would be CAUSE, the second EFFECT.


I hope you are as mad and upset about what these graphs show as I am. They get my vote as being a functional definition of a state that is an economic "basket case." Remember, it never had to be this bad here. The failure of collective economic leadership in this state over the last decade is what made Rhode Island so vulnerable to national and global economic weakness. Existing structural problems, the manifestations of which are listed below, allowed our state to move from its usual doldrums into "afterburners." Consider the following "stylized facts:"
  • Rhode Island was one of the first states to experience persistent budget deficits;
  • Rhode Island's employment peaked in January of 2007, almost a year before the national employment peak;
  • Rhode Island's economy went into recession in June of 2007 (based on my Current Conditions Index), six months before the US recession began; and
  • Rhode Island was losing population consistently since July of 2004 when it moved into recession.
Rhode Island's current problems therefore have a very large structural component. Don't let any state politician tell you otherwise. If one of them tries to say this, or their new favorite: "We're all in the same boat,"confront them with the reality that we are indeed different in a number of fundamental ways from other states.

Let me end my first blog post with the way I view the "positive" people among those who run our state. Anyone currently in office who says that you should always view the glass as being half full is expendable. Any non-incumbent who utters this should be considered irrelevant.