Yesterday we received the April labor market data for Rhode Island. While many celebrated the fact that our state's jobless rate fell below 9%, I raised the question, as I have on numerous occasions over the years, about whether or not this is truly cause for celebration. Clearly, a lower jobless rate is preferred to a higher one. However, is important to assess not only the level of the unemployment rate but the reasons that underlie how (and why) it is changing.
My guess is that many people here believe that the April decline in our labor force that accompanied our jobless rate improvement really isn't very important, and that somehow this was a one time or rare event. Instead of my stating what I believe is the only reasonable conclusion here, I will let you judge for yourself. Below is a chart (click to enlarge) that shows Rhode Island's labor force and unemployment rate dating all the way back to 2009. Included in this chart is a vertical line denoting when the current recovery began (in February 2009).
I believe the graph illustrates rather conclusively that the combination of declines in both the unemployment rate and labor force is not the exception, but instead has been the rule over this entire period with few exceptions. Let me state that even prior to 2009, there were more instances that I can remember where we saw this combination of declines in both our unemployment rate and labor force.
In fact, when I designed my Current Conditions Index (CCI), I explicitly took this relationship into account, which I would not have done for any other state. Specifically, I included as two separate indicators the labor force and the unemployment rate. The significance of including them as a pair arises from months like April: an improving unemployment rate is a +1 for the monthly CCI value, while the decline in the labor force is a -1. The result is that these two changes cancel, leaving the monthly CCI value unchanged. Therefore, a decline in Rhode Island's jobless rate by itself does not necessarily improve the Current Conditions Index value for a given month.
Let me conclude by noting a unique fact for Rhode Island. Rhode Island is the only state that has been consistently losing population since July of 2004. In general, a smaller population adversely impacts the size of a state's labor force. In the coming months, this will make it more difficult for Rhode Island to reverse the well-established downtrend in its labor force.
A blog devoted to providing my perspectives on the Rhode Island economy that utilizes discussion, tables, graphs, and hyperlinks to illustrate key points and where I come a lot closer to saying what I really think than what I say to the general media. A DISCLAIMER: Everything in and on this Blog is solely attributable to me and bears no connection whatever to either the University of Rhode Island overall or the URI economics department.
Showing posts with label labor force. Show all posts
Friday, May 17, 2013
Sunday, October 2, 2011
It's Not Supposed to Be Like This!
Pardon the fact that I have not posted anything for a while, I switched from Cox Cable to FiOS (ready my post about issues I was having) and had to make all the required changes associated with this. Please note that my web site has now been moved to http://www.llardaro.com .
Recent gains in payroll employment here, which have at times appeared to defy gravity, seem to contradict any hint of weakness, reinforcing the declining unemployment reflects economic strength view. You might think that these large monthly employment gains have been a potential source of confusion to me, as my Current Conditions Index has continued to show a slowing pace of economic activity in Rhode Island. But as of 2011, I have been following Rhode Island's economy for twenty years. Suffice it to say that along the way I have observed and come to know all too many patterns and data combinations that reflect the idiosyncrasies of Rhode Island's economy.
But one doesn't need all this experience to know that it is always preferable to focus on a set of indicators, not any one single variable, to gain an accurate picture of Rhode Island's economic performance. That, of course, was the basis for my creating the Current Conditions Index. And even for a single indicator like payroll employment, there are often several related measures worthy of observation.
As I have discussed in prior posts, there are two measures of overall employment for Rhode Island. The first, which I have been alluding to above, is payroll employment, the number of jobs in Rhode Island. The second is resident employment, the number of Rhode Islander residents who are working, irrespective of whether this occurs in or outside of Rhode Island. One major difference between these is the inclusion of self-employed persons in resident employment. And that difference matters a great deal in the early stages of recoveries or at turning points for the economy.
The chart below shows the recent behavior for both employment measures here (click to enlarge):
Note that the year-over-year rate of growth for resident employment peaked before the end of 2010 and has continued to decline, becoming ever-more negative, as 2011 progressed. For payroll employment there is a very different story: after moving to a positive rate of growth in the beginning of 2011, growth continued to accelerate through June. For July there was a modest slowing in growth, before plummeting to an almost 0% growth rate in August. So, was employment here really rising or falling recently?
RESULT #1: Regarding the recent behavior of payroll employment: POSITIVE MEASUREMENT ERROR COMETH BEFORE THE FALL.
The dramatic-appearing run up in payroll employment should therefore be viewed as spurious, overstating payroll strength. In August, think of payroll employment figure as a "burp," expelling the measurement error that had accumulated in prior months.
Next, let's link the recent declines in Rhode Island's unemployment rate to changes in employment -- but the employment measure that is in the same survey it is -- the household survey (click to enlarge):
Shouldn't the unemployment rate only fall when employment is rising? While that certainly sounds reasonable and intuitive, it is not necessarily true. First, which measure of employment is this referring to? Second, since the beginning of 2011, Rhode Island's unemployment rate has been declining along with its resident employment.
RESULT #2: THE UNEMPLOYMENT RATE CAN DECLINE EVEN WHEN RESIDENT EMPLOYMENT IS FALLING.
Obviously, there must be another force at work for this to occur, one that is obviously not intuitive. That force is the behavior of our state's labor force, as the next graph shows (click to enlarge):
Rhode Island's labor force has been declining since early 2011, along with both resident employment and the number of unemployed. The fact that the number of unemployed has been declining, even though resident employment has also been falling, is what lies at the heart of the explanation of this strange seeming combination of changes.
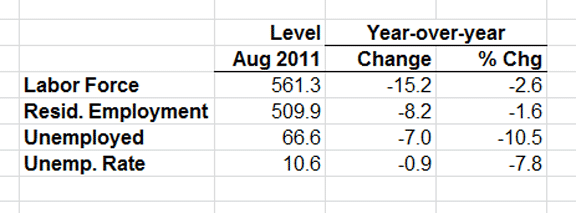
The math of August's numbers can be obtained from the following table (data in thousands) (click to enlarge):
Compared to last August, the number of unemployed Rhode Islanders fell by 7,000. That's the good news. But while this was occurring, Rhode Island's labor force declined by 15,200, and its resident employment dropped by 8,200. The trick to understanding this is knowing how the ultimate change in the unemployment rate is determined: the percentage change in the unemployment rate (-7.8%) is approximately equal to the difference between the percentage changes in the number of unemployed (-10.5%) and the labor force (-2.6%). To simplify this a bit: even though the number of employed Rhode Island residents declined compared to a year ago, in percentage terms, the fall in the number of unemployed was greater than the decline in the labor force. Also, note that while the fall in resident employment was a fairly large number (8,200), in percentage terms, this was "only" a fall of 1.6 percent, far smaller than the drop in the number of unemployed.
Let me conclude by moving from the math of these calculations and show that in spite of these percentage changes and the way the unemployment rate is calculated, the August data show that a substantial number of Rhode Island's unemployed dropped out of the labor force, presumably as they were unable to obtain suitable employment. Make no mistake, however, the simultaneous and relatively large drop in resident employment is every bit as troubling as this, as it is reasonable to conclude from this rather rare trend that thousands of self-employed Rhode Islanders also "threw in the towel" on their business enterprises. Either way, this indicates that Rhode Island has entered a period of slower economic growth, which is entirely consistent with the recent behavior of my Current Conditions Index.
RESULT #3: ALWAYS FOLLOW A SET OF ECONOMIC INDICATORS RATHER THAN A SINGLE ONE.
Monday, June 20, 2011
May 2011 Labor Market Data
The labor market data for May of 2011 have now been released. As always, Rhode Islanders and their media focused on the unchanged unemployment rate from April, 10.9%. And, in numerous stories, employment was described as "adding 1,300 jobs compared to April." If one goes behind the numbers, as I always do, there's a lot more going on, and as always, the jobs added figure that was reported was incorrect.
Perspective: I highly recommend that persons consider not just looking at data like this by focusing on the change from one month to the next (called month-to-month, or M/M). Very often it gets revised, so what we think happened this month ends up being changed, for better or worse, the next month. While it is useful (albeit fleeting) to look at month-to-month change, it is preferable to consider both what happened compared to a year ago (called year-over-year, or Y/Y) and the one-month change.
Unemployment Rate: Looking at Rhode Island's unchanged (M/M) unemployment rate in May, 10.9%, this was well below its level last May's value of 11.7%. However, our state's labor force fell over this period, by a number roughly equivalent to the decline in the number of unemployed. Conclusion: the "improvement" in our state's jobless rate from a year ago was largely due to unemployed Rhode Islanders dropping out of the labor force which statistically lead to their no longer being counted when the rate was calculated.
Another point I need to make concerns an extreme rarity that occurred with the May data. Unemployment data along with the number of working Rhode Island residents comes from the Household Survey. Forgive me as I provide the basic labor market identity:
Perspective: I highly recommend that persons consider not just looking at data like this by focusing on the change from one month to the next (called month-to-month, or M/M). Very often it gets revised, so what we think happened this month ends up being changed, for better or worse, the next month. While it is useful (albeit fleeting) to look at month-to-month change, it is preferable to consider both what happened compared to a year ago (called year-over-year, or Y/Y) and the one-month change.
Unemployment Rate: Looking at Rhode Island's unchanged (M/M) unemployment rate in May, 10.9%, this was well below its level last May's value of 11.7%. However, our state's labor force fell over this period, by a number roughly equivalent to the decline in the number of unemployed. Conclusion: the "improvement" in our state's jobless rate from a year ago was largely due to unemployed Rhode Islanders dropping out of the labor force which statistically lead to their no longer being counted when the rate was calculated.
Another point I need to make concerns an extreme rarity that occurred with the May data. Unemployment data along with the number of working Rhode Island residents comes from the Household Survey. Forgive me as I provide the basic labor market identity:
LF = E + U
or Rhode Island's labor force (LF) for any period is the sum of the number employed of employed Rhode Islanders (E), referred to as resident employment, plus the number unemployed (U) Rhode Islanders. Here's the rare occurrence we witnessed with the monthly data (change from April to May of 2011):
Change in LF = -1,400
Change in E = -1,400
Change in U = -100
Obviously, there is rounding error here which should be overlooked. Here's the oddity: while our state's unemployment rate remained unchanged at 10.9%, there were 1,400 fewer Rhode Island residents employed (we'll overlook the change in U here). How and why would employed Rhode Islanders drop out of the labor force? It would be very easy to explain why unemployed persons would drop out -- lack of job opportunities. But employed??? The best explanation I can come up with is that a number of self-employed Rhode Islanders weren't doing so well and packed things in (literally). I guess they then went to a status where they opted not to look for work, leading to roughly similar declines in resident employment and the labor force. Will this oddity be present when the June data are released in a month? I wouldn't at all be surprised if it disappears!
Employment: As if all of this weren't confusing enough, there are actually two separate measures of employment. The first, presented above, from the household survey, is resident employment, the number of Rhode Islanders working, whether in Rhode Island or somewhere else. There is a second survey, the establishment survey, that counts the number of jobs in Rhode Island, or payroll employment. Unlike resident employment, this measure does not count self-employment. And, in order to compare adjacent months, the data must take seasonality into account, using seasonal adjustment.
Comparing month-to-month changes in employment, for resident employment, there was a decline of 1,400 (see above). For payroll employment, the gain that was reported was 1,300. The fact that there were different changes in both measures is not uncommon. What must be taken into account, however, is that the payroll employment figure for jobs added is almost always reported incorrectly.
To give a sense for why this is so, let me change to year-over-year payroll employment change, the measure I pay most attention to since monthly changes are often modified the next month. The chart below (click to enlarge) gives the number of jobs added and jobs lost over the last year.
Let's focus on May of 2011. For that month, Rhode Island had job gains of 9,500 versus job losses of 5,300. The net change in employment (year-over-year) was therefore 4,200. The local media, however, always reports this as 4,200 jobs added, which is clearly incorrect. Since February of this year, job gains in Rhode Island have clearly accelerated. Sadly, job loss has remained stubbornly high, leading to overall employment growth (i.e., change) of less that one percent (0.9% for May).
So, this look into the labor market data released each month should illustrate that there's a lot more going on than any simple explanation can accurately conclude. Keep in mind that there are two labor market surveys, not one, and these often reflect different forces at work and thus come to different conclusions. And, for someone who has been following all of this in depth for as long as I have, sometimes I don't even understand all of what's going on. I guess that's why God invented data revisions!
Subscribe to:
Posts (Atom)