Sunday, April 29, 2012

It Depends

One of the current success stories of late for Rhode Island has to be retail sales. Not only has retail sales been in a well-defined uptrend since the last quarter of 2009, at the present time it is very close to its highest level since 1990.

Retail sales can be either a coincident or lagging indicator, meaning that it either reflects what is going on at the present time or what has recently occurred. For Rhode Island, the most timely data on retail sales is that for retail sales subject to the sales tax. Based on when these taxes are paid and recorded here versus when the sales actually took place, retail sales for Rhode Island is a lagging indicator. Also, retail sales is a very cyclically sensitive indicator, which means the value of retail sales is very sensitive to the overall level of economic activity. The technical term for this is that retail sales are pro-cyclical, since they move in the same direction as the economy.

Like any economic indicator, it too has its limitations: since this is based on retail sales tax collections in Rhode Island, it excludes any items that are not currently subject to taxation, most notably clothing. And there can be distortions. For example, given the very mild winter, winter clothing expenditure very likely fell since the same time last year. If that decline was sufficient to move total retail sales lower than they were last year, the understatement from excluding clothing sales from our sales tax data might not be as large as it typically is. Similarly, since the meals tax in Rhode Island has been 14.7% higher than the regular sales tax rate for several years now, this has distorted "retail sales" for meals over this period -- tending to overstate the overall total. While this may sound like minutia, it is important to understand that every economic indicator has its share of "baggage." I have believed for quite some time now that the indicator any person likes best is probably the one that person knows the least about.

Let's take a look at the historical performance of retail sales in Rhode Island, using as our basis quarterly data on retail sales subject to the sales tax expressed at an annual rate. The chart below (click to enlarge) shows values since the first quarter of 1990. Please note that the vertical axis is stated in logarithms, mainly because a given vertical distance represents the same percentage (relative) change between any two period in the chart.


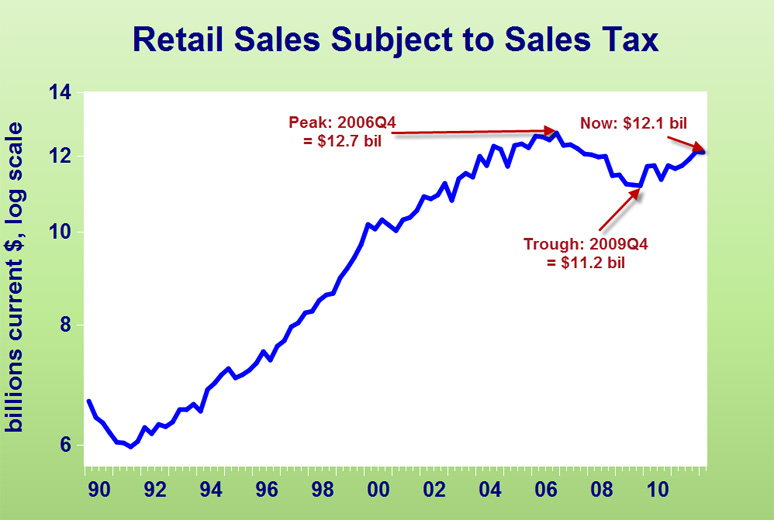
The most recent peak in retail sales occurred in the fourth quarter of 2006, at $12.7 billion. Can you think of anything else that happened that quarter (hint: we have discussed this numerous times in prior posts)? The answer: it coincides with Rhode Island's most recent employment peak. This reflects the fact that retail sales are very sensitive to the overall level of economic activity, as stated earlier. The trough for retail sales was in the fourth quarter of 2009, at $11.2 billion. Thus, Rhode Island's peak-to-trough decline in retail sales was 11.8 percent. Note that retail sales have trended upward throughout this recovery, although not straight up. Once again, the cyclical nature of retail sales is in evidence here.

This chart provides an excellent illustration of the mindset of most, if not all, of Rhode Island's leaders, its media, and its residents: things here have now turned around nicely, and Rhode Island is doing much better it has in a very long time. Add to this the fact that income tax revenue is up, at least above expectations, and if you read my last post, employment is apparently higher and our state's jobless rate is lower than the currently published data indicate. Thus everything appears to have returned to normal.

I agree totally with the assessment that everything here has returned to normal -- but Rhode Island's "new normal." In economics, we never look at things in absolutes. Instead, we always evaluate things in relative terms. This precludes our making substantive judgments about the behavior of indicators that are stated in current dollars, as retail sales is above. So, let's now turn to evaluating retail sales here in relative terms -- meaning relative to the purchasing power of the present time. This, recall, means examining the historical behavior of real retail sales.

The next chart shows the behavior of real retail sales subject to the sales tax for Rhode Island since 1990 (click to enlarge). As should become readily apparent almost immediately, this gives a very different picture of our current situation.


When taking inflation and purchasing power into account, the peak in real retail sales occurred in the third quarter of 2004, at $14.8 billion. This peak thus came well before the current dollar peak (in 2006Q4). Note that by stating retail sales in the purchasing power of Q1 in 2012, we are "inflating" current dollar values from earlier periods into what they would be if dollars then had the same purchasing power as today, which explains why earlier current dollar values are higher when stated in real terms. The trough in real retail sales occurred in the fourth quarter of 2009, at $11.9 billion. This is the same quarter as the trough in current dollar retail sales.

The reality of Rhode Island's current situation, our "new normal," to quote the phrase coined by Mohammed El-Erian of PIMCO, is in fact very different from the predominant view of our state's economic performance. First, real retail sales here have been falling since the third quarter of 2004, well before our most recent employment peak. Second, the peak-to-trough decline in real retail sales here was much greater than one would conclude based on current dollar values, just under 20 percent. Third, while real retail sales have improved since their trough in 2009Q4, they have registered almost no gain since that time: $12.1 billion versus $11.9 billion. Finally, the most recent trend in real retail sales is sideways to downward. Thus, Rhode Island's economy has failed to perform well enough to consistently generate retail sales growth rates in excess of inflation for quite some time now.

Where does all of this leave us? Not where almost everyone in this state appears to believe. Retail sales data, when viewed in the correct context of real values, confirms something I have written about in more posts than I care to think about, that Rhode Island is in a very tepid recovery. So, even when (or if) current dollar retail sales here exceeds it recent high of $12.1 billion, we will not have returned to anywhere even remotely close to where we once were. So, do we continue to contrast the current situation with the depths of where we once were, as seems to be the dominant view, or should we shift our focus to where we are relative to recent heights? You can guess which I will continue to opt for.

We should be attempting to move toward recent highs -- that should be the standard of excellence or satisfactory performance here. And, guess what? That outcome doesn't just fall on us from heaven. We have to work for it. And very often, this will require that we work very hard to get there. I heard a great saying a few months ago that pertains to this: "Success is not a destination, it is a journey." It's time for Rhode Island to purchase its ticket for this journey, because the dominant perspective here, to dust off an old phrase I used to use to describe Rhode Island about a decade ago, defines success in terms of "Relative Mediocrity."

Friday, April 20, 2012

A Different Way to Calculate RI Employment: The Dawn of a New Era?

As we recently discovered, the revised data on Rhode Island's payroll employment are going to be significantly different than the currently published numbers. First, these will now be calculated by the US Bureau of Labor Statistics (BLS). The BLS will not incorporate Rhode Island's idiosyncrasies, as manifested in its idiosyncratic data, in the same way as the Rhode Island Department of Labor and Training (DLT) has in the past. Second, as the basis for making ongoing monthly estimates of Rhode Island's payroll employment with the Current Employment Survey (CES), BLS projections will start with an earlier time period than has historically been used by Rhode Island's DLT. As a general forecasting rule, the farther from known data one projects, the greater the variability of the estimates will likely be. Taken together, these changes can be viewed as constituting a different methodology. Most importantly, expect this new methodology, which officially begins with the February 2013 data report, to produce differences with respect to both the reported values of payroll employment each month, and even more importantly, their volatility through time.

Today's ProJo story by Kate Bramson quoted an economist from the BLS New England office in Boston, Timothy Consedine, as stating the reasons for these changes: " ... to improve cost efficiency and 'to reduce the potential for statistical bias in state and area estimates.' "

It's certainly hard to argue with either of these noble intentions. Now let's put these assertions to a test. Since March of 2011, the manufacturing wage data for Rhode Island has been calculated by the BLS. Assuming that Mr. Consedine's assertions are correct, manufacturing wage data here should have improved at least by a bit, if not by a great amount, since the BLS took over their estimation. There has indeed been an extremely visible difference since that time. I won't tell you what it is. Instead, I will provide two charts of Rhode Island's manufacturing wage behavior and let you see if you can figure out what this change has been. In both charts, RI and US wages are contrasted. The first chart (click to enlarge) shows US and RI manufacturing wage growth since January of 2008.

Click on Read more to see the charts.

Tuesday, April 17, 2012

Current Conditions Index Report: February 2012


Below is an abbreviated version of the February Current Conditions Index report. The full report (with indicator table) is available on my web site: http://www.llardaro.com/ . The value of the CCI, 50, its neutral value. Based on currently released data, Rhode Island is at a near standstill.

Apparently, however, data revisions that will occur with the next round of rebenchmarking (to be released next February), paint an entirely different picture of the behavior of employment. In other words, the currently released employment data is far off the mark: while the currently published data show seven consecutive employment declines (year-over-year), according to the revised data, no declines might have actually occurred. Let me be clear about this: this is in no way the fault of the RI Department of Labor and Training (DLT). Instead, it is the direct outcome of the different methodology utilized by the US Bureau of Labor Statistics (BLS) for obtaining employment values that will be replacing the methodology historically used by the Rhode Island DLT with the next data rebenchmarking.

So, assuming that actual employment is apparently moving in the opposite direction of the values currently being published, the most likely changes to the February CCI would pertain to both Employment Service Jobs and Private Service-Producing Employment. Even though each of these declined according to the existing data, it is highly likely that both will have increased according to the newly revised ("shadow") data. If that is what ultimately ends up occurring, the February CCI value will increase to 67, a very different value than the 50 based on the data the DLT is publishing at present.

I'm sorry for the confusion, but up to now, I have always been able to rely on the data published by the DLT. I still have full confidence in the RI DLT. However, it will now be necessary to begin relying far more heavily on the US BLS. Effectively, Rhode Island will be "homogenized" based on their national models. So for now, until the newly rebenchmarked data are released in February, it will be necessary for me to publish a range of likely CCI values -- until the BLS "shadow" employment numbers coincide with those being released by the DLT.

Friday, April 13, 2012

The Unexpectedly Strong Performance of Rhode Island's Manufacturing Sector

Rhode Island's manufacturing sector, like that of the nation, has continued to perform extremely well since 2009. Ironically, 2012 marks the 25th anniversary of Rhode Island being a post-manufacturing economy (here is the basis for this). Since late 1987, when this structural transformation occurred, the sectors that have led in the early stages of recoveries have conspicuously excluded our state's goods producing sector -- manufacturing and construction. So, while construction continues to remain extremely weak and depressed here, adding a further downdraft to our state's already weak economic momentum, manufacturing has provided a welcome boost throughout this entire recovery.

There are a number of reasons why US manufacturing (and related to this -- exports) has done so well. First and foremost is the US Dollar exchange rate. The dollar depreciation that has occurred over the past few years, driven largely by the extremely low interest rates orchestrated by the Federal Reserve, has made exports from the US much more competitive to foreign buyers than they otherwise would be. In addition to this, appreciation of the Japanese Yen has caused production costs there to become unacceptably high to a number of manufacturers, leading them to shift their Japanese production to other countries. To some extent, US manufacturing has benefited from this. Then there is the success of China as an exporter, which has produced upward pressure on manufacturing wages there and upward pressure on their currency, the Chinese Yuan. Finally, political pressure that continues to be applied to US manufacturers has led them to move some of their operations back to the US. The extent to which these factors have benefited Rhode Island manufacturing is not clear at this time. Since a study of this topic would entail due diligence, it is safe to conclude that no such study will ever occur here.

For Rhode Island, much of the recent manufacturing strength has been manifested in a return of the workweek from the highly depressed values it fell to during "The Great Recession" to more typical values. During the past three months, the workweek here has moved beyond the 40-hour level. In February of 2012, the average workweek, 40.7 hours, was the fifth highest length since 2000 (using the new industrial classification system that is as far back as we can go). The chart below (click to enlarge) shows Rhode Island's manufacturing workweek since 2000.


The first thing that stands out in this chart is the well-defined uptrend in the workweek since the trough in July of 2009 (before RI's current recovery began). Second, for the last three months (December of 2011 - February of 2012), the workweek has exceeded 40 hours, something Rhode Island hasn't seen since 2000. Finally, at its present level, the manufacturing workweek in Rhode Island is not very far from its "record" level over this period of 41.2 hours. 

So, along with the very favorable workweek behavior comes a potential caveat for the coming months: sustaining or even increasing the workweek in the future will not be an easy task. If the workweek begins to return to more "typical" levels, between 39 and 40 hours, which elements of our state's economy will take the "baton" and help to sustain Rhode Island's forward economic momentum from that time forward? The answer to that question is not at all obvious at the present time. In fact, even with all of this recent welcome manufacturing momentum, the negative forces at work here may well have gained the upper hand, to such an extent that Rhode Island's recovery might actually be over at the present time (see prior post that discusses this).

Let me conclude by noting that the substantially higher workweek we have been witnessing here represents firms substituting hours for the hiring of additional workers. As the inadequacy of the skills of Rhode Island's labor force is not debatable at this point, and as far as I can tell, nobody has ever accused Rhode Island's business climate of being competitive, the cost to firms associated with increasing employment, both in terms of skills and other costs, may well remain unacceptably high for our manufacturing firms for some time to come. This will remain central to defining our state's "limits to growth."

Tuesday, April 10, 2012

Recovery Rhode Island Style

Rhode Island never seems to do things like other states do. Sometimes that can be a good thing. But when it comes to economic performance, it has proven to be a nightmare: Our nightmare -- an extremely tepid recovery that might now be over.

In my first post on this Blog, I provided a series of charts comparing Rhode Island to the US, New England, Massachusetts, and Connecticut. I have (sadly) updated the most important of them, payroll employment, with the most recent data. The chart below shows this (caution: if you have just eaten, you should probably wait about an hour before viewing this chart. For those who haven't just eaten, click to enlarge):


I would hope that most people are aware of the following stylized facts that should be readily apparent from the chart:

  1. Payroll employment in Rhode Island peaked in December of 2006, well before the peaks in the US, New England, Massachusetts, or Connecticut;
  2. Rhode Island's payroll employment fell by a greater percentage than any of the other entities in the chart, by 8% from its peak;
  3. At its best during this recovery Rhode Island's payroll employment moved back to just slightly above 93 percent of its prior peak;
  4. All of the other entities in the chart have seen rising employment for some time now, moving ever closer to their prior peaks while Rhode Island has regressed -- its payroll employment is declining, falling back to just above 92 percent of its peak level.
  5. If you want to see what is happening to the unemployment rate in all of these entities, flip this chart upside down. This explains why Rhode Island has such a stubbornly high jobless rate -- we're not creating jobs!
An observation: during recoveries, payroll employment is supposed to continually rise. But this is Rhode Island. We don't do things here the same as everywhere else. If you look at my prior few posts, payroll employment in Rhode Island has now declined on a year-over-year basis for the past seven months. That by itself might be a sufficient basis to believe Rhode Island's recovery has ended and we have entered into the early stages of a double-dip recession. At present, I am not quite ready to make that call, but I think it is safe to say that if we are still in a recovery, we're hanging on by our proverbial finger nails.

Sunday, April 1, 2012

Believe It Or Not, Our Jobless Rate Could Be Worse

The last several posts have explored why Rhode Island has such a high unemployment rate. As of February, 2012, we have regained the dubious national rank of #2. If you saw the February labor market data for Rhode Island, the one number that probably stuck out was that our state's unemployment rate returned to 11 percent from just below that level the prior month. As for good news, the local media seemed to focus primarily on the 500 gain in payroll employment (seasonally adjusted). Actually, don't be very confident that the 500 gain will survive the data revisions associated with the release of the March data.

Actually there was good news  in the February report -- our state's manufacturing sector continues to improve. Both manufacturing employment and the workweek rose, very positive signs. And, our state's manufacturing wage continued to increase at an almost 20 percent year-over-year rate, if you are willing to believe that data (I don't!). Apparently there continues to be some life in Rhode Island's goods-producing sector, in spite of continued housing weakness!

By now, you should be aware of how many ironies permeate the existing labor market data for Rhode Island. To say this state is idiosyncratic is an understatement. So, let's delve into even more possible "confusion," focusing on labor force participation here and how its bad news has ironically translated into less horrible news for our jobless rate.

A state's labor force participation rate is the percentage of its working-age population that is in its labor force. For just about every state except Rhode Island, the labor force participation rate is pro-cyclical, meaning it changes in the same direction as overall economic activity. During recoveries, the participation rate rises, as a larger proportion of the working-age population becomes part of the labor force. Similarly, during recessions, the participation rate tends to decline, as some persons stop actively seeking work, which excludes them from being counted as part of the labor force. The reason why I noted this behavior is sadly not true for Rhode Island can be seen very readily from the following graph of our state's labor force participation rate since 2009 (click to enlarge).


Based on my Current Conditions Index, Rhode Island's present recovery began in February of 2010. As the above chart shows, Rhode Island's labor force participation rate has been declining throughout almost this entire recovery! So much for a pro-cyclical participation rate. Keep in mind, however, our state's employment rate has also been falling for quite a while (see prior post).

The irony associated with our state's declining participation rate is that it has actually kept Rhode Island's unemployment rate lower than it would have been had our state's residents not continued to drop out of the labor force. This is the "bad news translating into less horrible news" I referred to above.

All of this leads to an obvious question: How much higher would Rhode Island's unemployment rate have been were it not for the "benefit" of our declining participation rate? In order to approximate this, I performed a quick econometric simulation, assuming that our participation had not been declining from its most recent peak in April of 2010. The results are not pretty, nor are they unexpected. The chart below compares the actual and simulated unemployment rates here since 2009 (click to enlarge if you have a strong stomach!).


Instead of having an 11 percent unemployment rate for February of 2012, my simulation produced a rate of 11.6 percent. In the above chart, note the divergences between actual and simulated unemployment rates since August of last year. About the only good thing that can be concluded from this chart is that the two series have gotten closer of late. That is hardly a source of comfort, however, especially since at an 11 percent rate, Rhode Island has a national rank of second overall.

In conclusion, is Rhode Island's declining labor force participation rate a major problem? Indeed it is. Not only is it the logical result of a truly deplorable labor market, where both payroll and resident employment have been falling on a year-over-year basis for quite some time now. It may single-handedly be preventing Rhode Island from reclaiming its prior title as the highest unemployment rate in the entire United States!