Tuesday, December 14, 2010

Current Conditions Index: October 2010

October marked the first real challenge to Rhode Island’s economic recovery. After surviving its first test in September, sustaining an expansion reading (of 58) with two of the “foundation” indicators failing to improve, October saw the Current Conditions Index fall to 42, a contraction-range reading.Retail Sales, which failed to improve in September, showed a strong increase in October, rising by 5.6 percent. Its upward trend clearly remains intact at this time. But US Consumer Sentiment, another of the elements of our recent “foundation,” failed to improve once again, falling this month by 4.1 percent. To some extent this is not surprising, since it had an extremely difficult “comp” - it rose by 22 percent last October. And, prior to these recent declines, its consecutive improvement streak had been very long. As of now, it does not appear that the trend in this indicator has reversed.

The possibility of trend reversals for several other indicators might be in progress, though. Single Unit Permits, which reflects new home construction, fell sharply in October, by 28 percent, to an annualized rate of only 615 units. While it is not realistic to assume that levels such as this will persist, its “comps” over the next few months will be difficult to beat. So we will likely see some weakness in this indicator for the next several months. A similar behavior might also occur for the Labor Force. This indicator has improved for a very long time, but this string of improvements was linked to the need for unemployed persons to be actively seeking employment to qualify for benefits. As increasing numbers of Rhode Islanders exhaust all benefit entitlement, if they stop actively seeking employment, the Labor Force will decline for months to come. Ironically, the flip side of those changes would be substantial improvements in our state’s Unemployment Rate. Much of the recent decline in our jobless rate has been the result of unemployed persons dropping out of the labor force (October was the sole exception to this of late). So, expect to see further declines in our state’s Unemployment Rate in the coming months. Its effects on the CCI will be exactly offset by declines in the Labor Force, a feature I built into this index from the beginning.


For October, we again witnessed strength in our state’s manufacturing sector. Total Manufacturing Hours rose by 2.2 percent, powered by yet another sharp increase in the length of the workweek. October was the fourth consecutive improvement in this indicator, an anomaly for Rhode Island. Along with this, the Manufacturing Wage rose again, by 3.8 percent. Benefit Exhaustions, which reflects long-term unemployment, fell sharply, dropping by 24.8 percent, its eighth consecutive improvement. But New Claims, a leading indicator that measures layoffs, rose by 4.9 percent, a potentially discouraging development. Employment Service Jobs, another leading labor market indicator, fell by 13.2 percent compared to a year ago, but its value has plateaued since June. Private Service-Producing Employment fell again (-0.8%), its rate of decline moderating. Finally, Government Employment declined by 0.3 percent in October, fueled largely by a decrease in local non-education employment. The likely absence of any future assistance from the federal government should cause future deterioration.


The Bottom Line:
October’s Current Conditions Index reading illustrates just how shallow Rhode Island’s present recovery is. Our relatively slow emergence from “The Great Recession” leaves us with little margin for error. Ongoing state budget deficits, absent any further assistance from the federal government, will keep our state in a largely reactive mode and (too) highly reliant on national growth to sustain this recovery in coming months.

Thursday, December 2, 2010

Should We Be Afraid of Rising Interest Rates?

Recently, interest rates have been rising. The 10-year government bond rate, which is highly correlated with mortgage rates, has gone from around 2.5% to 3.0%. Some in the media have been assuming that this is a warning sign of future problems, most notably inflation associated with the Federal Reserve's efforts to push the economy to a faster growth rate (called Quantitative Easing 2, or QE2). In their view, QE2 has not had, nor will it have, much if any positive effects on growth. They presume its effects will be entirely felt with the rate of inflation.

The recent run-up in the stock market, which began when QE2 was first announced, certainly argues against the no growth impact view. What forces generally drive interest rates higher? In general (but not always), interest rate rise for:
  • increases in the rate of economic growth;
  • higher levels of actual or expected future inflation; and
  • monetary tightening.
Note that the first two are often related -- higher growth does at times generate higher inflation.

I don't want this post to be a substantial debate about the direction inflation is going to go, because economists really don't know the answer with much certainty at present. Instead, let me provide you with something to reflect on concerning the speculation by the media that interest rates are rising very sharply -- it is called historical perspective.

The chart shows the 10-year government bond rate since the late 1980s (click to enlarge this image). First thing to note: the value on the right must be divided by 10 to get the actual interest rate. So the most recent value, 30.0, really means a rate of 3.0%.

As this graph shows, while the 10-year bond rate has recently increased, it is very far below either historical values (the high was 8.25% in 1991) and the trend value at present (6.3%).

Recent Interest Rate Increases Have Been Exaggerated by the Media

Is the recent increase something to be worried about? Rates are still extremely low by historical standards at the present time.

So, how likely is it that this rate will jump and approach its current trend value or higher? The way you should approach this is to ask what it would take for this to occur. Don't merely assume that it will occur. In other words, critique what you hear from the media.

Thus, dramatic increases in economic growth or inflation would be required for this to occur, using the three factors above, since monetary policy isn't about to tighten any time soon. I think it is safe to say that the US is not about to move in hyper drive when it comes to economic growth. We are very likely stuck in the 2-3% growth range for some time to come. Will inflation take off? While it is true that the US dollar has weakened somewhat since QE2 began, which causes commodity prices to move higher (this is why gas prices are now at or above $3 per gallon, for example), this by itself isn't enough to fuel a large increase in inflation. Economic strength in developing countries (like China, India, and Brazil) is a major contributor to rising commodity prices, given the recent changes in the value of the US dollar.

The recent increase in the 10-year government bond interest rate is thus related to the acceleration of economic growth -- in both the US (note the improving economic statistics recently) and in developing economies. Recent increases in commodity prices are inflationary. But for inflation to be impacted, these price increases would have to continue through time. Weakness in Europe and Japan will moderate inflation pressure in the coming months, as will ongoing productivity growth, which provides employers with a cushion as input costs are pushed higher by rising commodity prices. Can recent rates of increase in economic growth be sustained here and in developing countries? That remains to be seen.

Persons (and the media) in the US often don't think globally. They attempt to explain everything in terms of what is currently happening in the US. If you want to grasp what is really going on with many important economic variables, like interest rates, it is necessary to consider a global context and several different but related markets. Welcome to the new world!

Monday, November 29, 2010

Third Quarter GDP Report for the US -- Can We Predict This Before the Report is Released?

The revision to third quarter 2010 GDP was released last week. The original estimate, 2.0%, was revised up to 2.5%, a more "respectable" number than the original. In the first release of each quarter's GDP number, inventories, exports, and imports are all approximated. Subsequent months will use available data to eliminate the "educated guesses" contained in the first estimate. That was the case for today's release. Here is a story discussing the GDP release.

As the official GDP releases represent somewhat "stale" data, we can approximate what they will entail using real-time data from asset markets, which has been a central theme of my classes. To do this, go to StockCharts.com and on the middle right select the PerfChart (this stands for Performance Chart) that deals with the sectors of the S&P 500. To save you time and effort, here is the link.


PROCEDURE:
First, choose a bar chart at the bottom left (second button from the left). Then, move the slider (bottom right) to cover the exact time period you desire. Here, I have used the third quarter of 2010.

ANALYSIS:
Observe which sectors have performed better than the S&P 500 index (i.e., outperformed the overall market). This occurs when the S&P 500 button at the top left of the chart is selected.

For the third quarter of 2010, clearly the most cyclically sensitive sectors outperformed the market, with the exception of Financials. Overall, this is a reflection of the growth that occurred during that quarter. Had the defensive sectors (i.e., Consumer Staples, Health Care, and Utilities) outperformed, this would have signaled a potentially weakening economy.

Can this analysis be used to help predict the GDP report before it is actually released? The answer is yes. Asset markets, one of which is the stock market, are leading indicators, which means they tend to move in advance of changes in other parts of the economy. So, current changes in leading economic indicators tend to signal future changes we can expect to observe in the overall economy.

What is the stock market (and its sectors) telling us about the fourth quarter rate of economic growth? The second chart (click to enlarge) shows market performance since October 1. Other than Energy and Consumer Discretionary stocks (which themselves are cyclical), the remainder of cyclical indicators are performing less well than they did in the third quarter. The apparent message is that economic growth in the fourth quarter will be slower than it was in Q3, or spotty at best in comparison.

There are two things that should be noted. First, there is no indication that economic growth will become negative in Q4. Second, the slowing of economic growth these sectors seem to be indicting also affects the defensive sectors, so they are more negative than they were in Q3. Part of this no doubt reflects ongoing worries about the US housing market and the economic stability and solvency of several European countries as well (Ireland, Portugal, Spain, Italy, and Greece, sometimes referred to as the PIIGS, using their first letters). Will economic weakness in Europe diminish the recent momentum the US has been experiencing? The market apparently believe that this is likely.

Let me suggest that you continue to follow the sectors as we move farther into the fourth quarter and see what the market is suggesting. We won't get the initial Q4 GDP data until late in January, so this should be informative in advance of the formal data in January (that will be stale at that point).

Tuesday, November 16, 2010

September Current Conditions Index Report (for historical reports and this report as PDF files go to: http://members.cox.net/lardaro/current.htm

Rhode Island’s recovery continued in September, its fourth month. While the value of the Current Conditions Index remained at 58 this month, the list of indicators that improved changed somewhat. While Retail Sales and US Consumer Sentiment have both shown improvement for quite some time now, fundamental to helping the CCI to form its base in the expanding range, both failed to improve in September.  The fact that the CCI was able to remain in the expanding range in spite of both indicators failing to improve is a very positive sign for Rhode Island. Declines like this are not uncommon for indicators that have improved consecutively for many months. This most likely reflects a “pause” for both indicators, as their uptrends remain intact at this point. Improving economic momentum at the national level should benefit both of these in the coming months.

September’s economic data were more positive than the CCI’s value of 58 would appear to indicate. On a monthly basis, eleven of the twelve CCI indicators either improved or were close to improving. Once again, strength in our state’s manufacturing sector led the way, as its rebound continued. Total Manufacturing Hours rose again (+0.9%), powered by yet another sharp increase in the length of the workweek. This indicator has now improved for the last three months, something Rhode Island hasn’t seen since the year 2000. Along with this improvement in Total Manufacturing Hours, the Manufacturing Wage rose gain by a greater than 4 percent rate (+4.2%). The other part of our goods producing sector (Mining doesn’t matter here), Single-Unit Permits, which reflects new home construction, continued its recent roller coaster behavior, rising by 16 percent compared to last September. As noted earlier, Retail Sales failed to improve in September, declining by 2.7 percent compared to a year ago, its first decline in the last eight months. Along with this, US Consumer Sentiment fell (-7.5%), breaking a string of seventeen consecutive improvements.


Our state’s Labor Force rose again, increasing by 0.2 percent compared to a year ago.  While our Unemployment Rate fell to 11.5 percent from August’s value of 11.8, this was once again at least partially the result of monthly declines in our   Labor Force. Benefit Exhaustions, which reflects long-term unemployment, fell sharply again, dropping by 31.2 percent in September, its seventh consecutive improvement. New Claims, a leading indicator that measures layoffs, fell by 2.4 percent versus last September, further erasing the effects of recent consecutive increases. While Employment Service Jobs, another leading labor market indicator, fell by 11.6 percent compared to a year ago, on a monthly basis, this indicator appears to have plateaued since June. Stabilization in this indicator will be critical to sustaining Rhode Island’s newly found recovery momentum. Private Service-Producing Employment fell again (-1.2%), with its rate of decline accelerating slightly in September. Finally, Government Employment declined in September, by 0.2 percent, fueled largely by a decrease in local non-education employment. While visual examination of the data for this indicator seems to show a leveling off, Rhode Island’s persistent deficit woes coupled with the likely absence of any future help from the federal government should cause its eventual deterioration.

THE BOTTOM LINE:
September was month four for Rhode Island’s current recovery. While CCI readings remained at 58, barely into the expansion range, the fact that this value was sustained in spite of declines in two indicators that had led the way into recovery is encouraging, as is recent national economic momentum. At this point, let’s hope that this momentum can be sustained, especially as the next fiscal year approaches.

Wednesday, November 3, 2010

September 2010 Data

The September data for Rhode Island show an economy that is continuing to improve. The table below (click to enlarge) gives the values for a number of key variables. Note that a number of the values from last September were fairly weak, making them easy "comps" and not too difficult to beat. Most notably, two of our strongest performers of late, Retail Sales and US Consumer Sentiment, failed to improve in September from a year ago. But other variables stepped in to take their place among improving parts of our economy.


Happily, I can say that Rhode Island's current recovery, which began in June of this year, has continued through September and shows no signs of disappearing.

Tuesday, October 26, 2010

The Solution to RI's Woes Has a Political Basis (an article the ProJo wouldn't publish)

Rhode Island has been through a great deal over the last three and a half years. I don't need to cite the statistics. All of us have had to live with them. Suffice it to say that after a truly horrendous year in 2008, our economy regained its "pulse" as of mid-2009. By the middle of this year it appeared that we were about to bottom at long last. Then, in April came the floods, which very likely postponed that bottom for several months. The question has now become what type of recovery will Rhode Island eventually have?

The vast majority of persons who attempt to answer that question, many of whom are politicians, will no doubt restrict their analysis either entirely or largely to cyclical factors. That is unfortunate since far too much of Rhode Island's unsatisfactory performance over the past several years has been driven by structural factors. Cyclical forces did matter, but they became the "afterburners" for a direction materially dictated by our state's structural deficiencies (see the earlier post that discusses this).

Normally, when I discuss our state's structural deficiencies, I focus on the very obvious problems with our state's tax and cost structure. That extends well beyond taxes, as we also have severe competitiveness issues based on our fees, regulations, electricity costs, and the skills of our labor force. However, as we move into this election season, during the late stages of our state's worst economic crisis since 1991, it is essential that we shift our focus to identifying the fundamental causes of our state's structural deficiencies so that remedial action can hopefully be undertaken. While it might sound strange coming from an economist, I believe that major changes to our state's economic climate over the longer term are predicated largely on structural political changes.

First, and foremost, Rhode Island can no longer afford a part-time legislature. I recommend a full-time legislature with four-year terms and a term limit of two terms. Details on pay and benefits will have to be worked out. This would largely eliminate obvious conflicts of interest and help us eliminate end-of-session flurries of bills that allow the elite of the legislature to capitalize on the benefits of the old saying: “In chaos there is profit.” But there is a more fundamental economic reason for this recommendation: During the worst of the global economic free fall of late 2008, our legislators ended their session and returned to their regular jobs, leaving our state entirely in reactive mode. I won’t argue with the legislators for leaving, they had to provide for themselves and their families. However, their inaction guaranteed that if and when they ultimately decided to attempt change, they would be forced to deal with a far more difficult and unforgiving economic climate. Rhode Island cannot afford to ever let this happen again.

Throughout the entire period since our state's employment peaked (in January of 2007), the legislature did virtually nothing to help us emerge from this recession, in spite of spending many hours doing who knows what. That combination, of course, is the definition of low productivity. Such low productivity argues strongly in favor of the need to downsize. So, my second recommendation is for us to dramatically downsize our state's legislature to approximately 50 persons in total. At this point, we should seriously consider moving to a unicameral legislature as well. As scary as it sounds, candidates for the legislature would actually have to run against someone and say what they believe! Even if we remain a largely one-party state, at least we would see meaningful debate during the primary season. Furthermore, since this state has been woefully inadequate in terms of undertaking due diligence over the years, we must provide the downsized unicameral legislature with meaningful research capabilities for its members. Contrary to the prevailing wisdom here, the long run doesn't just happen - you can actually plan for it! We need to institutionalize due diligence immediately.

The last set of recommendations deal with the obvious fact that affordability has never been a fiscal policy criterion for Rhode Island. First, I recommend that the Governor be given a Line Item Veto. Besides spicing things up, this would permit much more debate, not only among the legislative and executive branches, but among the public as well during a time of enhanced information availability and the desire for transparency in government. Second, as we will no doubt eventually enlarge revenue sources in the future, we must institutionalize the notion of earmarked expenditures. For example, if (more likely when) the state's sales tax base is broadened, we must earmark the added revenue (derived from consumption) exclusively for investment-oriented uses such as funding for public higher education. Not only would that provide an automatic linkage between consumption and investment-oriented spending, it would enhance future economic growth and tax revenue as well, while allowing us to end our state's de facto development policy: "Information age, hold the information." Last, and by no means least, we must regionalize municipal services so that we can at long last take advantage of our state's size, utilizing untapped economies of scale that promise to help us eliminate our structural deficits.

Persons reading this are probably thinking, how can anyone say that the legislature hasn't done anything during this recession? Aren't they passing income tax and regulation change legislation? Let's be honest - the primary reason this legislation has emerged now is because we are moving into the heart of election season. The legislature apparently discovered a political answer to a basic physics problem: How can you hit a home run when you never swing at the ball?" If you recall, the legislature rejected virtually all of the changes proposed by Governor Carcieri's tax commission, which were broader than those now considered, a few years ago. Because that legislature inaction forced our state to waste precious time, not only did we continue to be pummeled in just about every fifty-state business climate comparison, further damaging our state's image, it prevented us from moving beyond the lag time involved whenever fiscal policy changes are made. So, even if the "new" set of tax and regulation changes were passed and enacted tomorrow, the six to twelve month lag involved means that realistically their effects will not be felt until late 2011.

For a state our size with so many towns, school districts, so large a bicameral legislature, and such an abundance of structural economic impediments, maybe we should just rename our state "Redundancy Island" and call it a day. If the legislature ends its newly found penchant for action after the upcoming elections, that will probably be the best way for our state to proceed.

Wednesday, October 13, 2010

Scary Questions about R.I.'s Economy (from the ProJo 10/9/2010 as I originally wrote this plus a labor market chart)

Everyone seems to gauge overall economic performance by the recent performance of the unemployment rate. If you listen to the media and my many of my fellow economists, you will frequently hear that the only way the unemployment rate can decline is for employment to begin rising substantially from where it is today. These newly added jobs will then directly reduce unemployment, leading us at long last to a period where the unemployment rate is well below its current levels. There are two potential difficulties within this scenario, which explains why this process is taking so long. On the labor supply side, much of the current unemployment is long-term in nature, the result of jobless persons failing to possess the skills demanded by the employers who are attempting to increase employment. Economists refer to this as "structural unemployment." The result is skill shortages, even with so high a jobless rate. On the demand side, employers have continued to find ways of meeting current product demand with fewer hours worked by their labor force than they thought possible in the past. This has produced rather sharp gains in productivity. The failure to hire by small and medium-sized firms has been exacerbated by their inability to borrow funds due to inadequate collateral. And, of course, uncertainties about the future also play a role, for firms of all sizes.

But is this the only possible scenario? And, how does all of this pertain to Rhode Island? Actually, employment gains have been occurring here for several months now. Since October of 2009, job gains have generally been above 1,000 each month (except for April of 2010). In fact, over the October 2009 through August 2010 period, Rhode Island's average job gain (year-over-year) has been just over 2,000 per month (see chart below -- click to enlarge it). How can this be with so high an unemployment rate? The answer is that while job gains are occurring, so too are job losses. From October 2009 through August 2010, monthly job losses for Rhode Island averaged around 15,250. Thus the proper context for analyzing overall employment change in Rhode Island is a simultaneous focus on job gains and job losses. While monthly job loss has declined sharply since the height of the post-2008 period, job gains have increased very little. But they are increasing. So, the question becomes what will be required for Rhode Island to generate substantial and increasing job gains?


 A viable response to this question requires that we confront what I view as the two scariest questions about Rhode Island's economy at present. First, does Rhode Island have a tax and cost structure consistent with generating the types of employment gains needed to substantially reduce unemployment? Second, what are our current engines of job growth? Importantly, these questions are not unrelated. Our children have known the answers for years. Ask them when they come back to Rhode Island to visit. The answer to the first question is not yet, even with the two-year-delayed tax reforms. As for the second question, our engines of growth at present are health services and tourism. While a small but growing tech sector is helping us, past failures of economic leadership here have relegated non-defense tech to levels that require time before they can make a substantial impact on our state's overall rate of growth.

Fortunately or not, for Rhode Island there is another way we can and likely will witness material reductions in our jobless rate. Rhode Island has a very high labor force participation rate, the proportion of our (non-institutional) working age population that is in the labor force. At present, Rhode Island's participation rate is just under 69 percent, a rate almost five full percentage points above the national rate. Over the past five months, as Rhode Island's unemployment rate fell from 12.5 percent to 11.8 percent, its labor force participation rate also fell. This indicates that some of our state's unemployed stopped looking for work over that period. Based on the way labor force statistics are calculated, they were no longer counted as being in our state's labor force. So, as increasing numbers of Rhode Islanders exhaust all benefit entitlement, if they then stop seeking employment, as is likely, our state's unemployment rate could potentially decline substantially from its current level, even without large employment gains.

June marked the third anniversary of Rhode Island's current recession. We have been through a great deal since our recession began in June of 2007. Perhaps that understates things a little (if that is possible) since our employment peaked in January of 2007, almost a full year before the national peak. Things never had to be this bad for Rhode Island. Is the second way I suggested for reducing our state's unemployment rate the best we can do? I refuse to believe that.

November's elections hold the potential for our state to make meaningful changes to the way things are done here. Voters must ask very difficult questions and demand highly specific answers to anyone running for statewide office. Sorry, wish lists don't work here!
  1. Candidates should be forced to outline in detail how Rhode Island will emerge from this recession.
  2. What specific measures do they propose for materially increasing job gains relative to the losses that will occur over the next two (or four) years?
  3. What are Rhode Island's economic strengths? How can those be built upon (i.e., what is Rhode Island's niche)?
  4. What are Rhode Island's major economic weaknesses? They should outline in detail proposals to eliminate these, or to somehow turn them into positives.
The upcoming election is more important than is generally presumed for Rhode Island, since federal bailout money will no longer be available by this time next year. Fiscally, this will force us to go "cold turkey." The resulting jolt to a fragile upturn may well force our state into a double-dip recession. The citizens of this state need to be proactive, even though our elected officials seldom are.

FOR A COMPLETE HISTORY OF THE CURRENT CONDITIONS INDEX AND ITS PERFORMANCE, VISIT MY WEB SITE: http://members.cox.net/lardaro/ . THE SECTION ON THE CURRENT CONDITIONS INDEX IS: http://members.cox.net/lardaro/current.htm .


Tuesday, October 5, 2010

August Data for RI

The August data for Rhode Island show an economy that is continuing to improve. The table below (click to enlarge) gives the values for a number of key variables. Note that a number of the values from last August were fairly weak, making them easy "comps" and not too difficult to beat. Strange as it might sound, that's how an economy pulls itself out of recession -- beating weak values forming a base to expand from.

Wednesday, September 22, 2010

With Recession Over, What's Next?

Now that the US recession has officially been declared as being over, the most obvious and pressing question is where we go from here?

As there are confusions about what a recession or recovery actually means (see the previous post), there are just as many confusions concerning whether we are actually in a recovery or a recession. I have provided a chart that will help to illustrate this point (click the chart to enlarge it).

I think it is safe to say that generally, most people refuse to believe the pronouncements of economists concerning when an economy is in the very early stages of either recession or recovery. Consider early recession in the chart. Note that the economy is not very far from its peak in economic activity. So, when economic data are released, the numbers are still very good in a historical context. In fact, unless you focus on what economists refer to as leading economic indicators, the numbers will show an economy that is still climbing the activity "hill" (i.e., to the left of the peak), making it even more difficult to assess what is actually taking place. Perhaps the best example of this is the one measure the general population focuses on most -- the unemployment rate. This is a lagging indicator, meaning its level at present reflects what happened in months past. Remember: a recession is NOT defined as a level of diminished economic activity. As the National Bureau of Economic Research (the "dating" body for economic cycles) points out, it is instead a period of diminishing activity. This highlights the distinction between levels and rates of change that I discussed in the previous post.

Right now, nationally at least, we find ourselves in the early stages of a recovery. Once again, look at the chart above. In the early stages of a recovery, an economy is close to the "bottom" of economic activity. The numbers that are released are therefore not going to be very good, and after a recession period, often discouraging. Of course, if you focus on lagging indicators, you will almost certainly conclude that we are still in a recession.

At this point, I need to reiterate that contrary to popular "wisdom," being in a recovery does not necessarily require a return to "normal" times and historical averages (or above) of economic variables. It might. But generally it takes some time to get back to "typical" levels. The next chart will help to explain this.

As this chart should illustrate, not all recoveries are alike. Each path reflects how rapidly economic activity will be rising in the future. Historically, when there is a very deep national recession like the one we just had, the economy rebounds quickly. This leads to a "V" shaped recovery (the green line). It doesn't take all that long to return to "normal" levels of economic activity. In that situation, a recovery feels like a recovery.

But recovery paths are different since not all recessions are the same. Global recessions occur over longer periods and are generally more damaging than more "typical" recessions. When there is a global recession with major financial problems, as the one we just had, the pace of recovery tends to be slow and it takes a longer time to return to "normal" levels of economic activity (the red line). Consider that at present, individuals are spending less, saving, and paying down debt. Banks have lowered leverage. All of this is very positive in the medium to longer term, but it extracts a cost on the rate of economic growth in the short term. Add to this  the fact that banks aren't lending as much as they might have in previous recoveries, and you get what Mohammed El-Erian of Pimco refers to as "The New Normal" (click here for a video of El-Erian explaining this concept). He and I are somewhat concerned with the possibility of deflation in the near-term as well.

So, where does all of this leave us? What are you to think? Hopefully you are now more aware of  the basics of what is really going on, what an early recovery means, and the possible paths the US economy might take. THE question is which path will be the one our economy follows. Let me be very honest about this: economists, including me, don't really know the answer to this, in spite of all our forecasts and predictions. In this context, let me state one of my favorite sayings: CERTAINTY IS AN ILLUSION. Any forecast, no matter who makes it, is essentially a scenario. It assumes what the areas are that will be the most important over the forecast period, how each of those areas will actually change, and the interactions between and among them. Obviously, there are numerous sources of potential error.

In a period of such uncertainty, where things seldom appear to be what they actually are, many persons are all too willing to step forward with their "solutions." While these might sound good, or appeal to the increasingly subjective notion of "common sense," they too are based on scenarios. So, they might be right. Or, they might be wrong. Let me recommend that you critique any or all of these within the context of one of my favorite sayings: "Complex problems have simple, easy to understand, wrong answers."

Let me finish by acknowledging that at this point you are no doubt wondering where I stand on the future path of economic growth. I will outline this in the coming days (it's time for me to get to class). Before doing that, I need to apply the information in these last two posts to what is occurring in Rhode Island. Stay tuned!

Monday, September 20, 2010

The US Recession is Officially Over

Today, the group officially responsible for applying dates to national business cycle turning points (i.e., recessions and recoveries), the National Bureau of Economic Research (NBER), declared that the most recent recession ended in June of 2009. Read their full statement.

Just as most people didn't realize we were in recession for quite some time after the most recent recession began, many didn't realize that we have now been in an economic recovery for over a year. There are several reasons for this.

First, a (national) recession is not defined the way most people think it is. Apparently almost everyone believes that a recession occurs when the US economy experiences at least two consecutive quarters where real (inflation-adjusted) GDP declines. This definition is predicated entirely on the behavior of a single variable -- national output, which would be declining for at least six consecutive months. Were this the definition, it would be very easy to "date" recessions: count to two after checking GDP releases, looking for negative growth rates. Second, the NBER does not do things this way, nor do they restrict their analysis exclusively to quarterly data. Read the Q&A about the way they define recessions and recoveries. In this, the NBER states a very important point: a recession isn't defined as being a period of low activity, but a time period of continually declining economic activity. Extending this to recoveries, these don't necessarily indicate a return to "normal" times. Instead, they reflect continually improving economic activity in a number of areas.

What is the actual definition the NBER uses to define a recession? According to the NBER, a recession is defined in the following way:

"The NBER does not define a recession in terms of two consecutive quarters of decline in real GDP. Rather, a recession is a significant decline in economic activity spread across the economy, lasting more than a few months, normally visible in real GDP, real income, employment, industrial production, and wholesale-retail sales."

So, from this, what we can infer is that as we are now about a year into a national economic recovery, economic activity in a number of areas is improving (on average). THIS DOES NOT MEAN WE HAVE RETURNED TO "TRADITIONAL" LEVELS OF THESE VARIABLES. That could take months or even years, especially as our economy is in a period where persons are saving and paying down debt, and bank lending is not as great as we would like to see it.

Confusion surrounding the dates of recessions and recoveries is the manifestation of a very basic observation I will make: persons instinctively focus on the levels of economic variables; economists extend this focus on levels to rates of change as well. So, the rate of economic growth is just that -- a rate of growth and thus a measure of rate of change. Actually, economists often go farther, as we are now concerned about whether the rate of economic growth will be slowing. This means economists are now focusing on rates of change (are we slowing?) in the rate of change (the rate of economic growth). You will often hear this referred to as the "second derivative" of economic activity. Clearly, economists think and speak a different language than do most people, often defying "intuition."

Sunday, September 19, 2010

Welcome to this Blog!

This is the first of what promises to be many posts to this newly created blog that will detail my views about economics and the Rhode Island economy using the tools of the internet. Unlike what I have been able to provide to the local newspapers over the years, this blog will include graphs, tables, videos, and other media-relevant tools that will allow me to communicate in a far more visual way than I could ever do in newspaper articles. Those who have come to my presentations over the years will already be familiar with the types of tables and graphs I will provide here. But, unlike what I am able to say to the local media, I will come far closer to stating what I really think in this Blog. The stakes now are far too high for us to sustain the way things are being done here.

Through time, I will publish articles that what I would have submitted as Op-Ed pieces to local newspapers in this blog. At times, posts might consist only of questions that need to be discussed and answered by others in this state. Let me state that I fully intend to provide realistic analyses of where Rhode Island's economy is and where it is headed, as I have done for years.

To a number of our state's "leaders" over the years, my efforts to do this have always been viewed as "being negative." But if we don't critically and honestly evaluate both the strengths and weaknesses of our state's economy, how can we realistically expect to make it better and stronger, able to move forward competitively? We didn't do this over the last decade, especially when we finally got back on our feet in the late 1990s when we had a clear window of opportunity (see my article from 1999  and the report card I proposed that our legislators use). The result was that we were "flat footed" during the worst recession this state has faced since 1991!

It is reasonable to ascertain that the persons who have labelled me as being negative are the image of what this state defines as being "positive." If impeding efforts to make this state more competitive in the future when we had a chance to do so, then abandoning the people of this state during its worst economic crisis in twenty years is Rhode Island's definition of "positive," then please do label me as "negative."

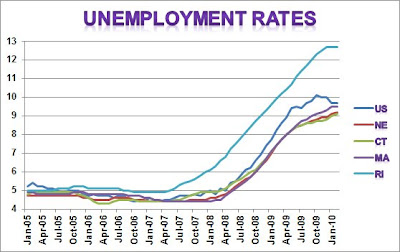
Consistent with using internet tools, let me present two graphs that scared the hell out of me from the moment I first created them (click to enlarge them). I knew things had been very bad here, but never this comparatively bad. I generated these while writing an article about Rhode Island's high unemployment rate for a Boston Federal Reserve Publication. If I had to name these, the first would be CAUSE, the second EFFECT.


I hope you are as mad and upset about what these graphs show as I am. They get my vote as being a functional definition of a state that is an economic "basket case." Remember, it never had to be this bad here. The failure of collective economic leadership in this state over the last decade is what made Rhode Island so vulnerable to national and global economic weakness. Existing structural problems, the manifestations of which are listed below, allowed our state to move from its usual doldrums into "afterburners." Consider the following "stylized facts:"
  • Rhode Island was one of the first states to experience persistent budget deficits;
  • Rhode Island's employment peaked in January of 2007, almost a year before the national employment peak;
  • Rhode Island's economy went into recession in June of 2007 (based on my Current Conditions Index), six months before the US recession began; and
  • Rhode Island was losing population consistently since July of 2004 when it moved into recession.
Rhode Island's current problems therefore have a very large structural component. Don't let any state politician tell you otherwise. If one of them tries to say this, or their new favorite: "We're all in the same boat,"confront them with the reality that we are indeed different in a number of fundamental ways from other states.

Let me end my first blog post with the way I view the "positive" people among those who run our state. Anyone currently in office who says that you should always view the glass as being half full is expendable. Any non-incumbent who utters this should be considered irrelevant.