If you've been reading my blog posts and writings over the years, you know that this is my preferred approach, one very different from what we often get from local media. All too often, they tend to view a single number such as the 2010 growth rate absent any meaningful historical context, basing their reports largely on that one number and the value that precedes it. This often paints a misleading picture, either overly optimistic or pessimistic, but reinforcing a perspective consistent with the most recent trend(s). So, let's take several views, but overall, use all of the information from the GDP release.
For 2010, the growth rate of real GDP for New England was 3.4% (relative to 2009). That was higher than the US rate, 2.6%, and every other region except for what the BEA refers to as the Mideast (the mid-Atlantic states). Within New England, Massachusetts had the highest 2010 growth, 4.2%, followed by Vermont with 3.2%, Connecticut at 3.1%, Rhode Island, 2.8%, Maine with 2.1% growth, and New Hampshire, 1.3%. So for 2010, Rhode Island ranked fourth in New England for real GDP growth.
If we were to merely focus on the results for 2010, the conclusion would be that Rhode Island turned in a very good performance, consistent with its very respectable national ranking. Let's now switch to a framework that looks at all of the data just released, which goes back to 2007.
The table below (click to enlarge) gives annual real GDP levels from 2007 through 2010 for our region overall and for each New England state as a percentage of respective 2007 values.
The first thing to note is that Rhode Island's real GDP fell by 2% 2008, a larger decline than either the region as a whole (actually the region increased that year), or any of the other states in our region. The entire region saw declines in real GDP in 2009. But since Rhode Island began a deep recession in mid-2007 (our real GDP fell 1% for that year), its relative position was even further diminished in 2009. For 2010, our region and each of its states improved from the levels in 2009, although three of the six New England states remained below their 2007 values. A quick examination of the table shows that as of 2010, Rhode Island remained farther below its 2007 real GDP than either the region as a whole or any other New England state. In fact, Rhode Island's ranking relative to its 2007 real GDP was the worst for the entire region.
So, while Rhode Island's 2010 growth rate of 2.8% was very good taken by itself, judging our state's current status by that single statistic is misleading. We're not back, especially compared to our neighboring states. But we have begun our move back -- according to my Current Conditions Index, our current recovery began in February of 2010. So,the 2.8% rate of growth for 2010 is that for the first year of our state's recovery, our version of a "V-shaped recovery" I guess.
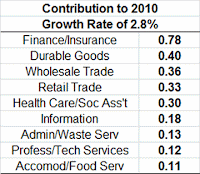
Let me conclude with a table (click to enlarge) that shows the major sectors that contributed to Rhode Island's 2010 growth rate and one comment.
The sectors contributing the most to 2010 growth were: Finance and Insurance, adding 0.78 percentage points to our growth rate of 2.8 percent; Trade, both wholesale and retail, were also major contributors, their total was 0.69 percentage points; and the pleasant surprise was Durable Goods Manufacturing, with 0.40 percentage points. Based on how beaten down manufacturing here became, and aided by US dollar depreciation, Rhode Island's manufacturing sector has been one of the "stars" of this recovery. The contribution above attests to this.
Let me conclude with my comment. While I have detailed the most recent real GDP report for Rhode Island and the New England states here, I have believed for a very long time that state-level real GDP is one of the least reliable and most "noisy" statistics for statewide economic activity. Consider that while the first table above shows that Rhode Island was only 1.1 percent below its 2007 real GDP level at the end of 2010, according to labor market data (a separate source from this), employment remained almost 8 percent below its level at the last cyclical peak (in December of 2006). I find it very hard to reconcile these two statistics. Yes, productivity growth has been extraordinary throughout this recovery. But that large a disparity seems a bit extreme to me. If history is any guide, next year's labor market revisions will show lower levels of employment than those currently published. I don't expect those revisions to be all that large, so substantial disparities will still remain in the "stories" told by the real GDP and employment data. I'm just not willing to buy it!


No comments:
Post a Comment